Winners of the MATLAB Online Live Editor Challenge
Today I’d like to introduce a guest blogger, David Garrison, who is a MATLAB Product Manager here at MathWorks.
Contents
The Results Are In!
Hello everyone. A few months ago I announced the MATLAB Online Live Editor Challenge - a competition for students and faculty to show off their live scripts. We received a lot of great entries from universities from all over the world. Loren has been kind enought to let me use her blog to show off the winning entries.
Winners in the Student Category
1st Place: Building a Forest of Trees in MATLAB
Ameer Hamza Khan - Hong Kong Polytechnic University

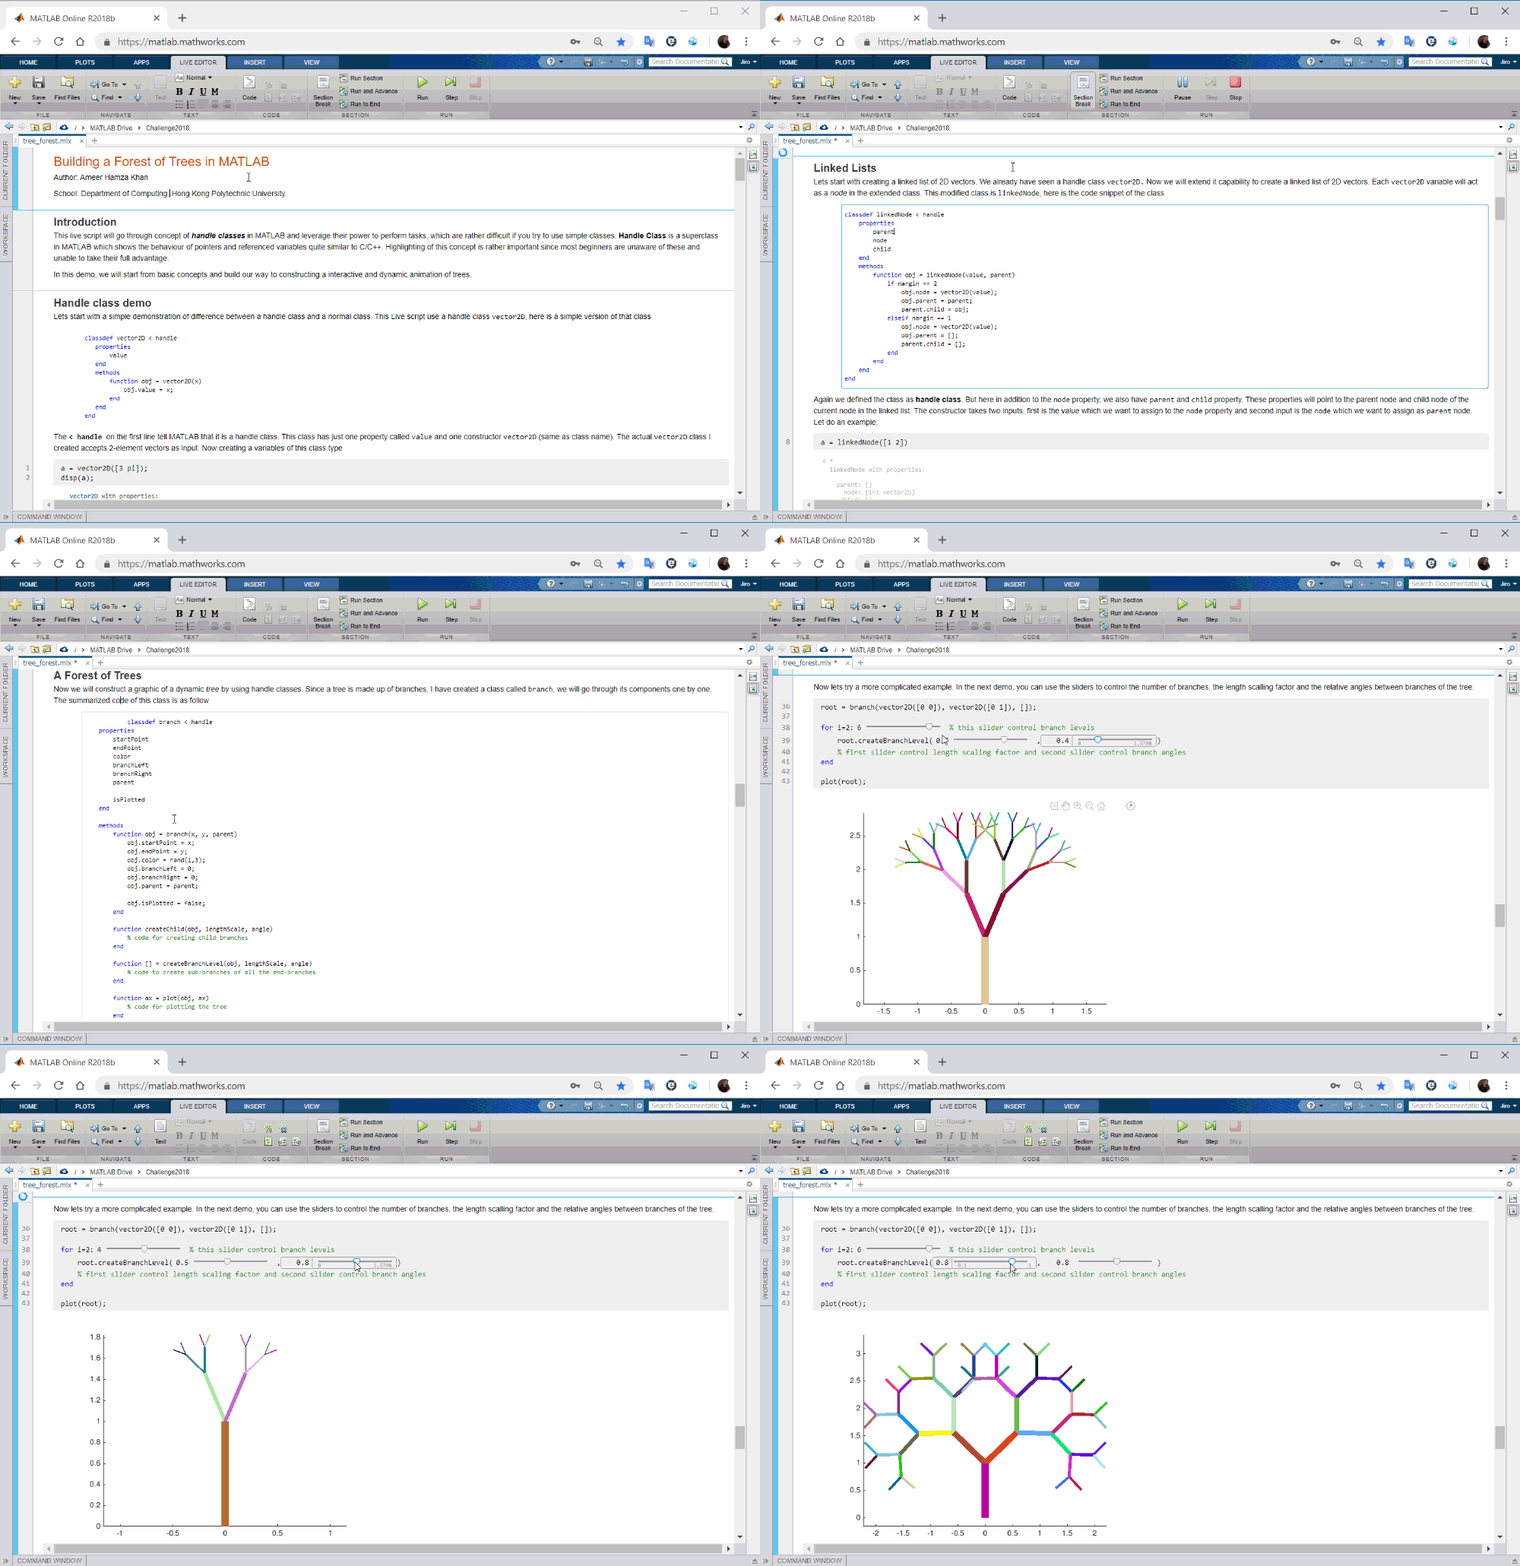
The Forest of Trees Live Script demonstrates how to create and visualize a tree data structure in MATLAB. It demonstrates how to use classes and object-oriented programming in MATLAB to construct custom data structures and uses MATLAB graphics to visualize and explain the tree data structure. The live script also makes use of numeric sliders to allow the user to customize their tree, and see how changing each option affects the resulting tree by watching the graphical output change in response to the slider.
2nd Place: How biodiversity is maintained in competitive ecosystems
Violeta Calleja Solanas - University of Zaragoza

This MATLAB live script demonstrates two models that explain species coexistence in ecosystems: high-order interactions and sort-ranged spatial interactions. The script simulates examples of ecosystems and uses live controls to allow users to interact with the models and observe the changes. The assumptions and equations behind each model are explained in the rich text. The script also explores the power law in the distribution of communities' sizes in the simulated ecosystem.
3rd Place: Neural Networks: The Universality Theorem
Mayank Jhamtani - Birla Institute of Technology and Science

The Neural Networks: Universality Theorem project explores the Universal Approximation Theorem, which states that a single layer of "artificial neurons" can be used to approximate any function, with an arbitrarily small approximation error. This project presents an intuitive proof of the theorem by means of visual aids. The project allows the user to vary the different network parameters to approximate an arbitrary function f(x).
4th Place: Calculate the Sag of Conductors using MATLAB
Timon Viola - Budapest University of Technology and Economics

This live script shows how to simulate the sag of power line conductors. It allows users to explore the effects of different parameters, such as temperature, conductor type, and tension span, on the calculation of points of the catenary. The results are visualized in a plot.
5th Place: Digital Processing of Electromyographic Signals for Control
David Leonardo Rodriguez Sarmiento: Antonio Nariño University

This live script shows how complex mathematical calculations of digital signal processing (DSP) can be performed to infer information from biological signals (biosignals) acquired by sensors
Winners in the Faculty Category
1st Place: The dynamics of rigid bodies system
Anna Sibilska-Mroziewicz - Warsaw University of Technology

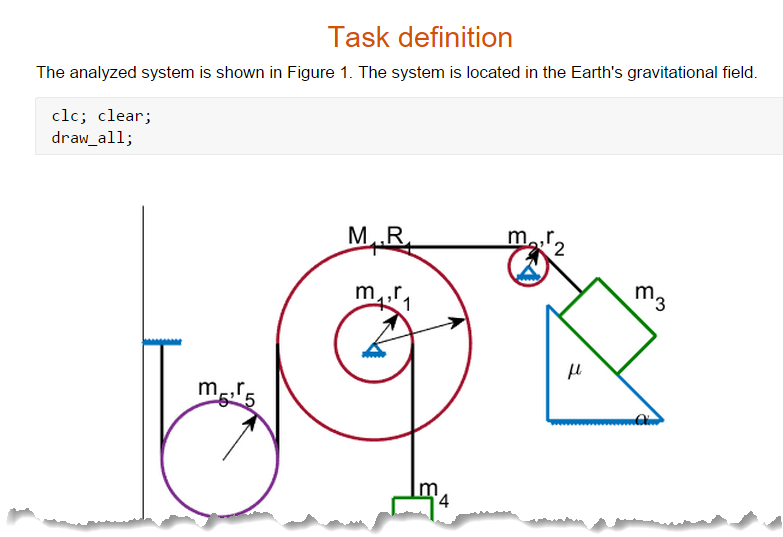
The Dynamics of Rigid Bodies Systems Live Script uses the power of live scripts to teach students the concept. It provides detailed graphics to illustrate a given system, and allows students to finalize the equations needed to model the system, providing useful, custom error messages if they model the system incorrectly. Students can adjust various values of system using numeric slider bars. The live script also makes use of the power of Symbolic Math Toolbox in its equations, including specifying units for each parameter in the system.
2nd Place: Influence Permanent Magnet DC Motor Parameters
Alexander Ivanov - Skolkovo Institute of Science and Technology

This live script explains the working principles of a PMDC motor and how it can be modeled. The transient process is calculated and plotted. The script also explores the influence of the armature resistance, armature inductance, armature inertia, magnetic flux and supply voltage on the transient process.
3rd Place: Visualization and analysis of an Electrocardiogram Signal
Constantino Reyes-Aldasoro - City University of London

The Electrocardiogram Live Script uses Signal Processing Toolbox to find peaks of data from an EKG and shows how to refine the peaks based on the user's data. The live script also shows how to gather data from various sources, including data from a web site, and provides some tips on visualizing complex data in MATLAB figures to help see critical regions, such as peaks, more clearly. In addition, it illustrates how to infer heart rate from the peaks of the electrocardiogram data.
What do you think about the winners?
Let the winners know what you think of their live scripts here.


Comments
To leave a comment, please click here to sign in to your MathWorks Account or create a new one.