
The Winter of Our Vectorization
Contents
Today I'd like to introduce guest blogger Matt Tearle who works on our MATLAB Product Training materials here at MathWorks. Matt is on a mission to teach the world MATLAB, but this winter is testing his resolve. Annoyed that 22" of snow forced him to reschedule a training, today he shows just how bad this winter had been.
Going the Whole 9 Feet
It has been a brutal winter at MathWorks' headquarters in Natick, MA (a little west of Boston). I recently read a fascinating article by MIT doctoral student Ben Letham who created a convincing visualization of just how relentless the snowfall has been this year. It was so convincing that I had to reproduce it myself (in MATLAB, of course!). In the process I had some fun with vectorization.
It's common to look at statistics like the largest amount of snowfall in a single day (23.5" on Feb 17, 2003) or the highest total for the entire winter (108.5" for 2014/15). But 6" of snow every day for a week would also cause chaos, even though it would seem mild by either of those measures. Hence, Mr. Letham's idea is to calculate the largest total of snow that fell during a range of given time periods -- three days, a week, two weeks, ... For example, 40.5" of snow fell during the worst week-long period this winter, compared to just over 31" in the worst week of 1995/96 (which had the most snow of an entire winter until this year) and only(!) 28.5" in 2002/03 (23.5" of which fell in one day).
When you plot these "worsts" for a range of time periods, you get:
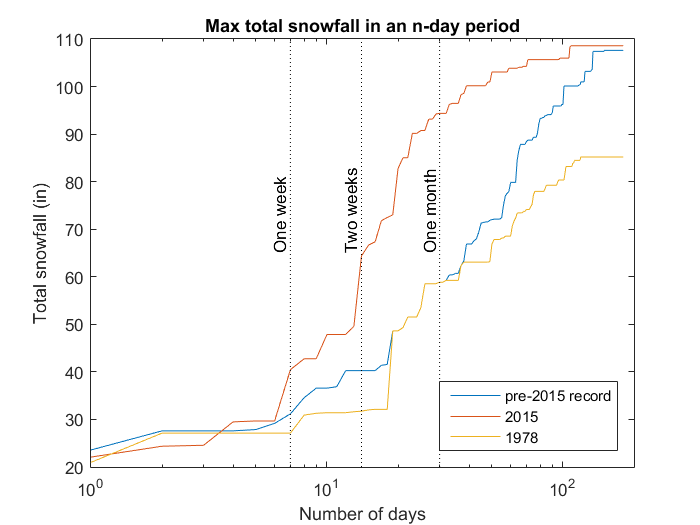
Sure enough, 2014/15 had the worst week ever, the worst two weeks ever, the worst month ever, the worst of just about any time period ever! And by some distance, too. The winter of 1977/78 is included because Boston locals talk with nostalgic reverence about the blizzard of 1978 that brought the area to a standstill. 1978 was pretty bad, but nothing compared to the snowfall we've had this winter.
Enter MATLAB
Intrigued by Mr. Letham's analysis, I wanted to play with the numbers myself. Like any good researcher, Mr. Letham documented his sources, which turned out to be NOAA's National Climatic Data Center. This meant that I could retrieve the data for myself and start playing (and so can you!). Before doing my own thing (which turned out to be fun, but a story for another day), I wanted to check that I could reproduce Mr. Letham's results. As it turned out, this helped me remember why I love MATLAB and gain appreciation for a function I had previously overlooked.
I downloaded the data from NOAA, used the Import Tool to import it into MATLAB, and did some basic preprocessing. As I often do, at this point I saved the cleaned-up data as a MAT-file, so I could now play with impugnity.
load snowfalls
Time for Some Logical Indexing
To compare different winters, I need to be able to extract the snowfall data for the given time periods. This is easily achieved with a combination of the date and time variable types that were introduced in R2014b and my all-time favorite MATLAB construction: logical indexing. I used the Import Tool to read the dates as datetime variables. Now I needed to separate 2014/15 from the rest of the data. Because the Northern Hemisphere winter crosses the new year, I decided to break years by the summer solstice (June 21):
pre2015 = (t <= datetime(2014,6,21));
snowPre2015 = snow(pre2015);
snow2015 = snow(~pre2015);
Numerical comparisons work naturally with datetime variables, so pre2015 is a logical variable which I can use to extract the snowfall values. To extract the year of the legendary blizzard, I used the handy isbetween function:
blizz = isbetween(t,datetime(1977,6,22),datetime(1978,6,21));
snow1978 = snow(blizz);
Convoluted, Yet Simpler
So now the crux of the problem: how to calculate the largest total over an $n$-day period. The typical programming language approach would be to loop over the array, taking $n$ elements starting with the $k^{th}$ element. But thinking about this process made me realize that I was looking for something very similar to a moving average. I knew that you can calculate moving averages in MATLAB by using convolution, implemented with the conv function. In this case, I want the sum (rather than the sum divided by $n$, as I'd want for an average). Hence, I can calculate all the $n$-day totals in a vectorized way:
n = 7;
ndaytotals = conv(snow2015,ones(n,1));
max7day = max(ndaytotals)
max7day =
   40.4724
Fun with arrayfun
Now I need to loop over $n$. I couldn't see any neat way to vectorize this, so maybe I should use a loop (remembering to preallocate):
nmax = 180;
ndaysmax = zeros(nmax,1);
for n = 1:nmax
    ndaysmax(n) = max(conv(snow2015,ones(n,1)));
end
I could also use arrayfun to perform this same operation without explicitly writing a for-loop:
nmax = 180;
calcndaymax = @(n) max(conv(snow2015,ones(n,1)));
ndaysmax = arrayfun(calcndaymax,1:nmax);
But is this really achieving anything? The code is very slightly more compact, but arguably more complicated (at least to someone who isn't a hard-core MATLAB-phile). I admit that, for this very reason, I tend to look down a bit on arrayfun as "how to cheat at vectorizing". But in this case I realized I had actually stumbled upon a great reason to use arrayfun...
Having applied this clever convolution operation to the 2015 data, I now need to do the same to the pre-2015 data and the 1978 data (and, presumably, any others that might strike me as interesting). Should I copy and paste code? No! This sounds like a job for a function. The "classical" approach would be to write a function that took an array of data and a maximum value of $n$ as inputs. It would return the maximum total for each $n$ from 1 to $n_{max}$. This wouldn't be a particularly difficult function to write, given that the code is basically done already (above). But do I really need to write a function file just for this? No: anonymous functions provide a way to create functions without writing a separate function file.
The one important caveat, though, is that anonymous functions must have a one-line definition (i.e., no loops!). So here's a compelling reason to use arrayfun: I can define my operation in a single line, enabling me to create an anonymous function, which can then be applied to any data set of interest:
nmax = 180;
maxXinNdays = @(x) arrayfun(@(n) max(conv(x,ones(n,1))),1:nmax);
Now I can apply this function to the snowfall data:
ndaysmaxPre2015 = maxXinNdays(snowPre2015);
ndaysmax2015 = maxXinNdays(snow2015);
ndaysmax1978 = maxXinNdays(snow1978);
Putting it All Together
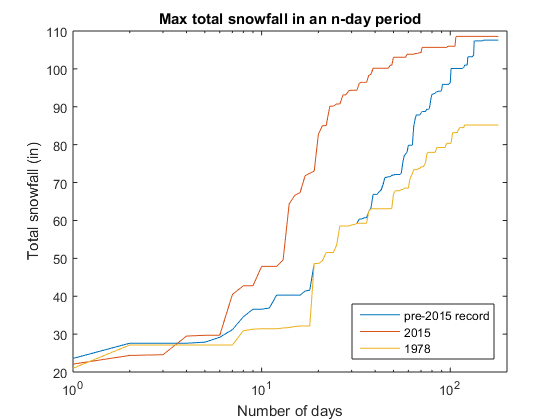
Now I have a fairly short script that performs the whole analysis, leveraging the power of an anonymous function vectorized with arrayfun:
load snowfalls

% Extract data for 2014/15 winter and for everything else until then
pre2015 = (t <= datetime(2014,6,21));
snowPre2015 = snow(pre2015);
snow2015 = snow(~pre2015);
% Extract data for the infamous winter of 1977/78
blizz = isbetween(t,datetime(1977,6,22),datetime(1978,6,21));
snow1978 = snow(blizz);

% Define a function that calculates the maximum total value in n
% consecutive elements of the array x, for n from 1 to nmax
nmax = 180;
maxXinNdays = @(x) arrayfun(@(n) max(conv(x,ones(n,1))),1:nmax);

% Use the function to compare snowfall totals
figure
semilogx(maxXinNdays(snowPre2015))
hold on
semilogx(maxXinNdays(snow2015))
semilogx(maxXinNdays(snow1978))
xlim([1 200])

% Annotate the graph
xlabel('Number of days')
ylabel('Total snowfall (in)')
title('Max total snowfall in an n-day period')
legend('pre-2015 record','2015','1978','Location','southeast')
Spring into Action!
You can download the data and code and try this out for yourself. (The data also includes temperature readings.) What other statistics or metrics can you calculate with this technique of vectorizing anonymous functions with arrayfun? Was 2015 really that bad? Let us know what you discover about the winter of our discontent here.


Comments
To leave a comment, please click here to sign in to your MathWorks Account or create a new one.