
Earlier this year, I blogged about charting my year of travels. Well, my year didn't go the way I expected it to go. The same for (almost?) everyone else.... 続きを読む >>
Note
Loren on the Art of MATLAB has been archived and will not be updated.

Earlier this year, I blogged about charting my year of travels. Well, my year didn't go the way I expected it to go. The same for (almost?) everyone else.... 続きを読む >>
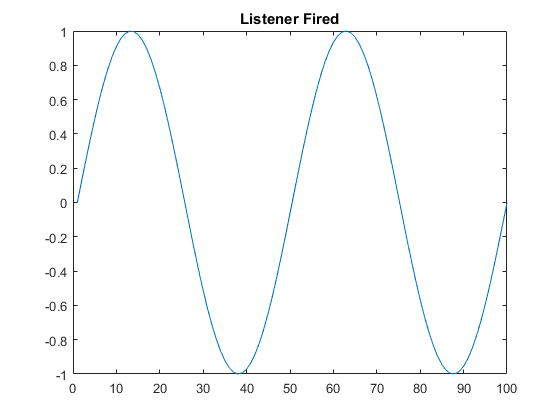
Today's guest post comes from Sean de Wolski, one of Loren's fellow Application Engineers. You might recognize him from MATLAB answers and the pick of the week blog!... 続きを読む >>
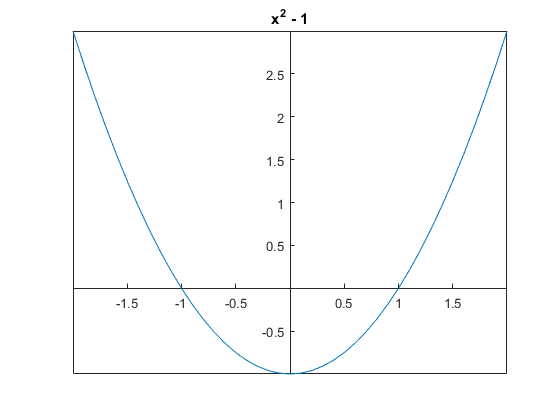
The R2015b release contains some new features for individual axis customization. Ben Hinkle, who works with the graphics team sometimes, goes through a number of plotting scenarios where these features can help simplify your code. This post shows some nicer techniques for making these pretty plots using R2015b vs. those in Loren's recent post using early versions of MATLAB.... 続きを読む >>
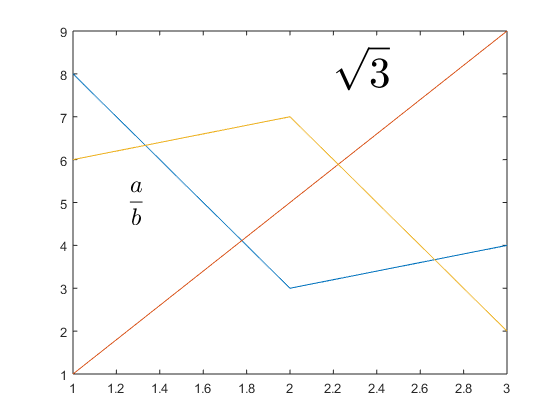
A few years ago, Jiro wrote a popular post for making pretty plots on this blog. We also host a blog specifically about graphics by Mike. And with the R2014b release of MATLAB came an updated graphics system that Dave described last year in a 3 part series: Part 1, Part 2, and Part 3.... 続きを読む >>
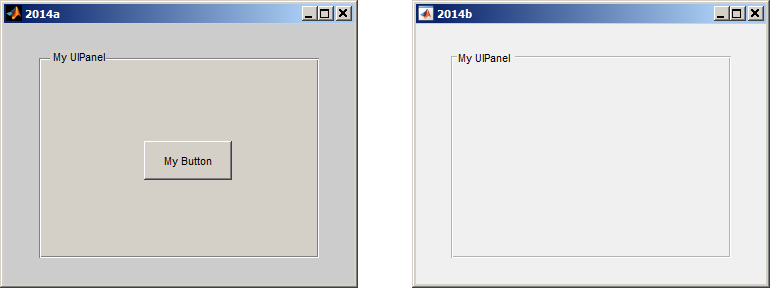
Today, David Garrison, our guest blogger, will continue his series on the new graphics system in R2014b.... 続きを読む >>

Today, David Garrison, our guest blogger, will continue his series on the new graphics system in R2014b.... 続きを読む >>

Today I’d like to introduce a guest blogger, David Garrison, who is a MATLAB Product Manager here at MathWorks. This is the first in a series of blogs over the next few weeks describing the new graphics system in R2014b and how some of the changes will affect you.... 続きを読む >>
Have you ever needed to move a figure? Perhaps because it is offscreen>? Or at least the menus or close box are not visible? This happens to me from time to time when I get code from someone else who is programming specifically to the size of their display. Working on a laptop, I often have fewer available pixels. What to do?... 続きを読む >>
Today, David Garrison and Sarah Wait Zaranek, today's guest bloggers, would like to ask for your help in tracking down interesting examples using MATLAB graphics and UI building capabilties.... 続きを読む >>
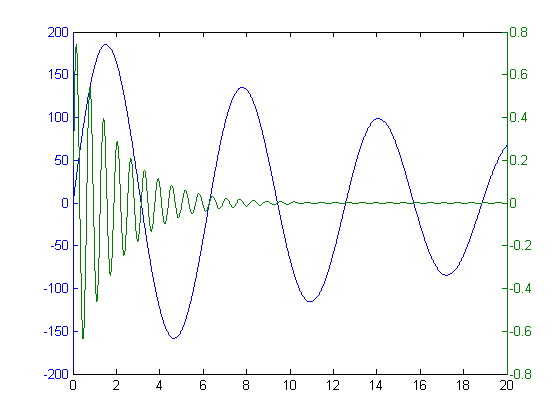
We were musing here about how common it is to want more than two Y axes on a plot. Checking out the File Exchange, there seem to be several candidates, indicating that this is something at least some people find useful.... 続きを読む >>