
How to Chart My Year (Redux)
Earlier this year, I blogged about charting my year of travels. Well, my year didn't go the way I expected it to go. The same for (almost?) everyone else.
Here's part of what I wrote: I travel a lot. Mostly for work. I do try to take advantage of the priviledge - visiting so many amazing places -- and spend a little extra time occasionally. People even joke that I should be writing a travel blog. Of course I prefer to write one on MATLAB. But how about combining these just for fun today.
Little did I know what the year had to bring to us. But I promised to fill in my year with pictures, and I will do the best I can here.
Contents
My "Calendar" for This Year
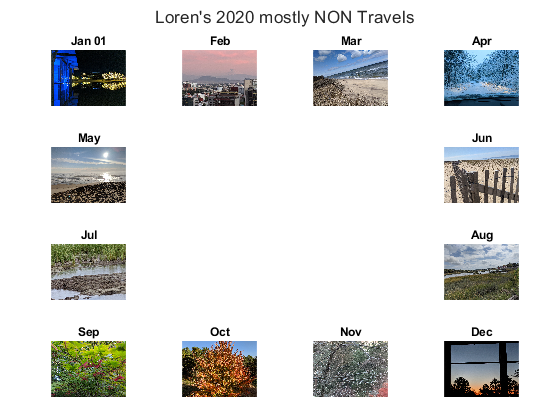
Here's the "calendar" for my (mostly) non-travels. I And I also wanted to show my meanders a bit as well. But since you won't see much happen on a map, I have included a montage of pictures I took on my very local meanderings throughout the seasons.
t = tiledlayout(4,4);
title(t,"Loren's 2020 mostly NON Travels")
t.TileSpacing = "compact";
t.Padding = "compact";
nexttile; imshow("mw01_2020.jpg"), title("Jan 01")
nexttile, imshow("mw02_2020.jpg"), title("Feb")
nexttile, imshow("mw03_2020.jpg"), title("Mar")
nexttile, imshow("mw04_2020.jpg"), title("Apr")
nexttile, imshow("mw05_2020.jpg"), title("May")
nexttile(8), imshow("mw06_2020.jpg"), title("Jun")
nexttile(9), imshow("mw07_2020.jpg"), title("Jul")
nexttile(12), imshow("mw08_2020.jpg"), title("Aug")
nexttile(13), imshow("mw09_2020.jpg"), title("Sep")
nexttile(14), imshow("mw10_2020.jpg"), title("Oct")
nexttile(15), imshow("mw11_2020.jpg"), title("Nov")
nexttile(16), imshow("mw12_2020.jpg"), title("Dec")
% nexttile(6,[2,2]); geoplot([-44 77],[172 20],"m-*")
Instead of a map, I will fill the middle with a montage of photos over the seasons here this year (including some wildlife!). Ones I often don't see since I've usually been elsewhere!
mydir = dir("*.jpg");
mydir = mydir(14:end-1);
nexttile(6,[2,2]); montage({mydir.name}), title("seasonal")

Two Pictures Not from New England
The first two pictures (January and February) are not from New England:
- January - the 1st - spent in Fort Worth, TX - nighttime view at the Modern Art Museum
- February - view of some volcanos from Mexico City hotel roof
As for the rest, I got to the beach in Massachusetts as often as possible, and managed to see quite a cross-section of wildlife in my yard and nearby.
Here's hoping we all have more choices in the coming year. Have a happy, healthy, safe 2021!
Notice how I lay out my grid of plots, which thankfully has room for 12 months surrounding the central montage of pictures. Did you know that you could lay out plots so nicely now? And add the all important annotations, plot by plot, including titles and axis labels? Let me know here.
- Category:
- Graphics


Comments
To leave a comment, please click here to sign in to your MathWorks Account or create a new one.