Sparklines Table 1.0
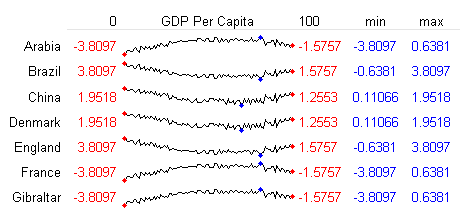
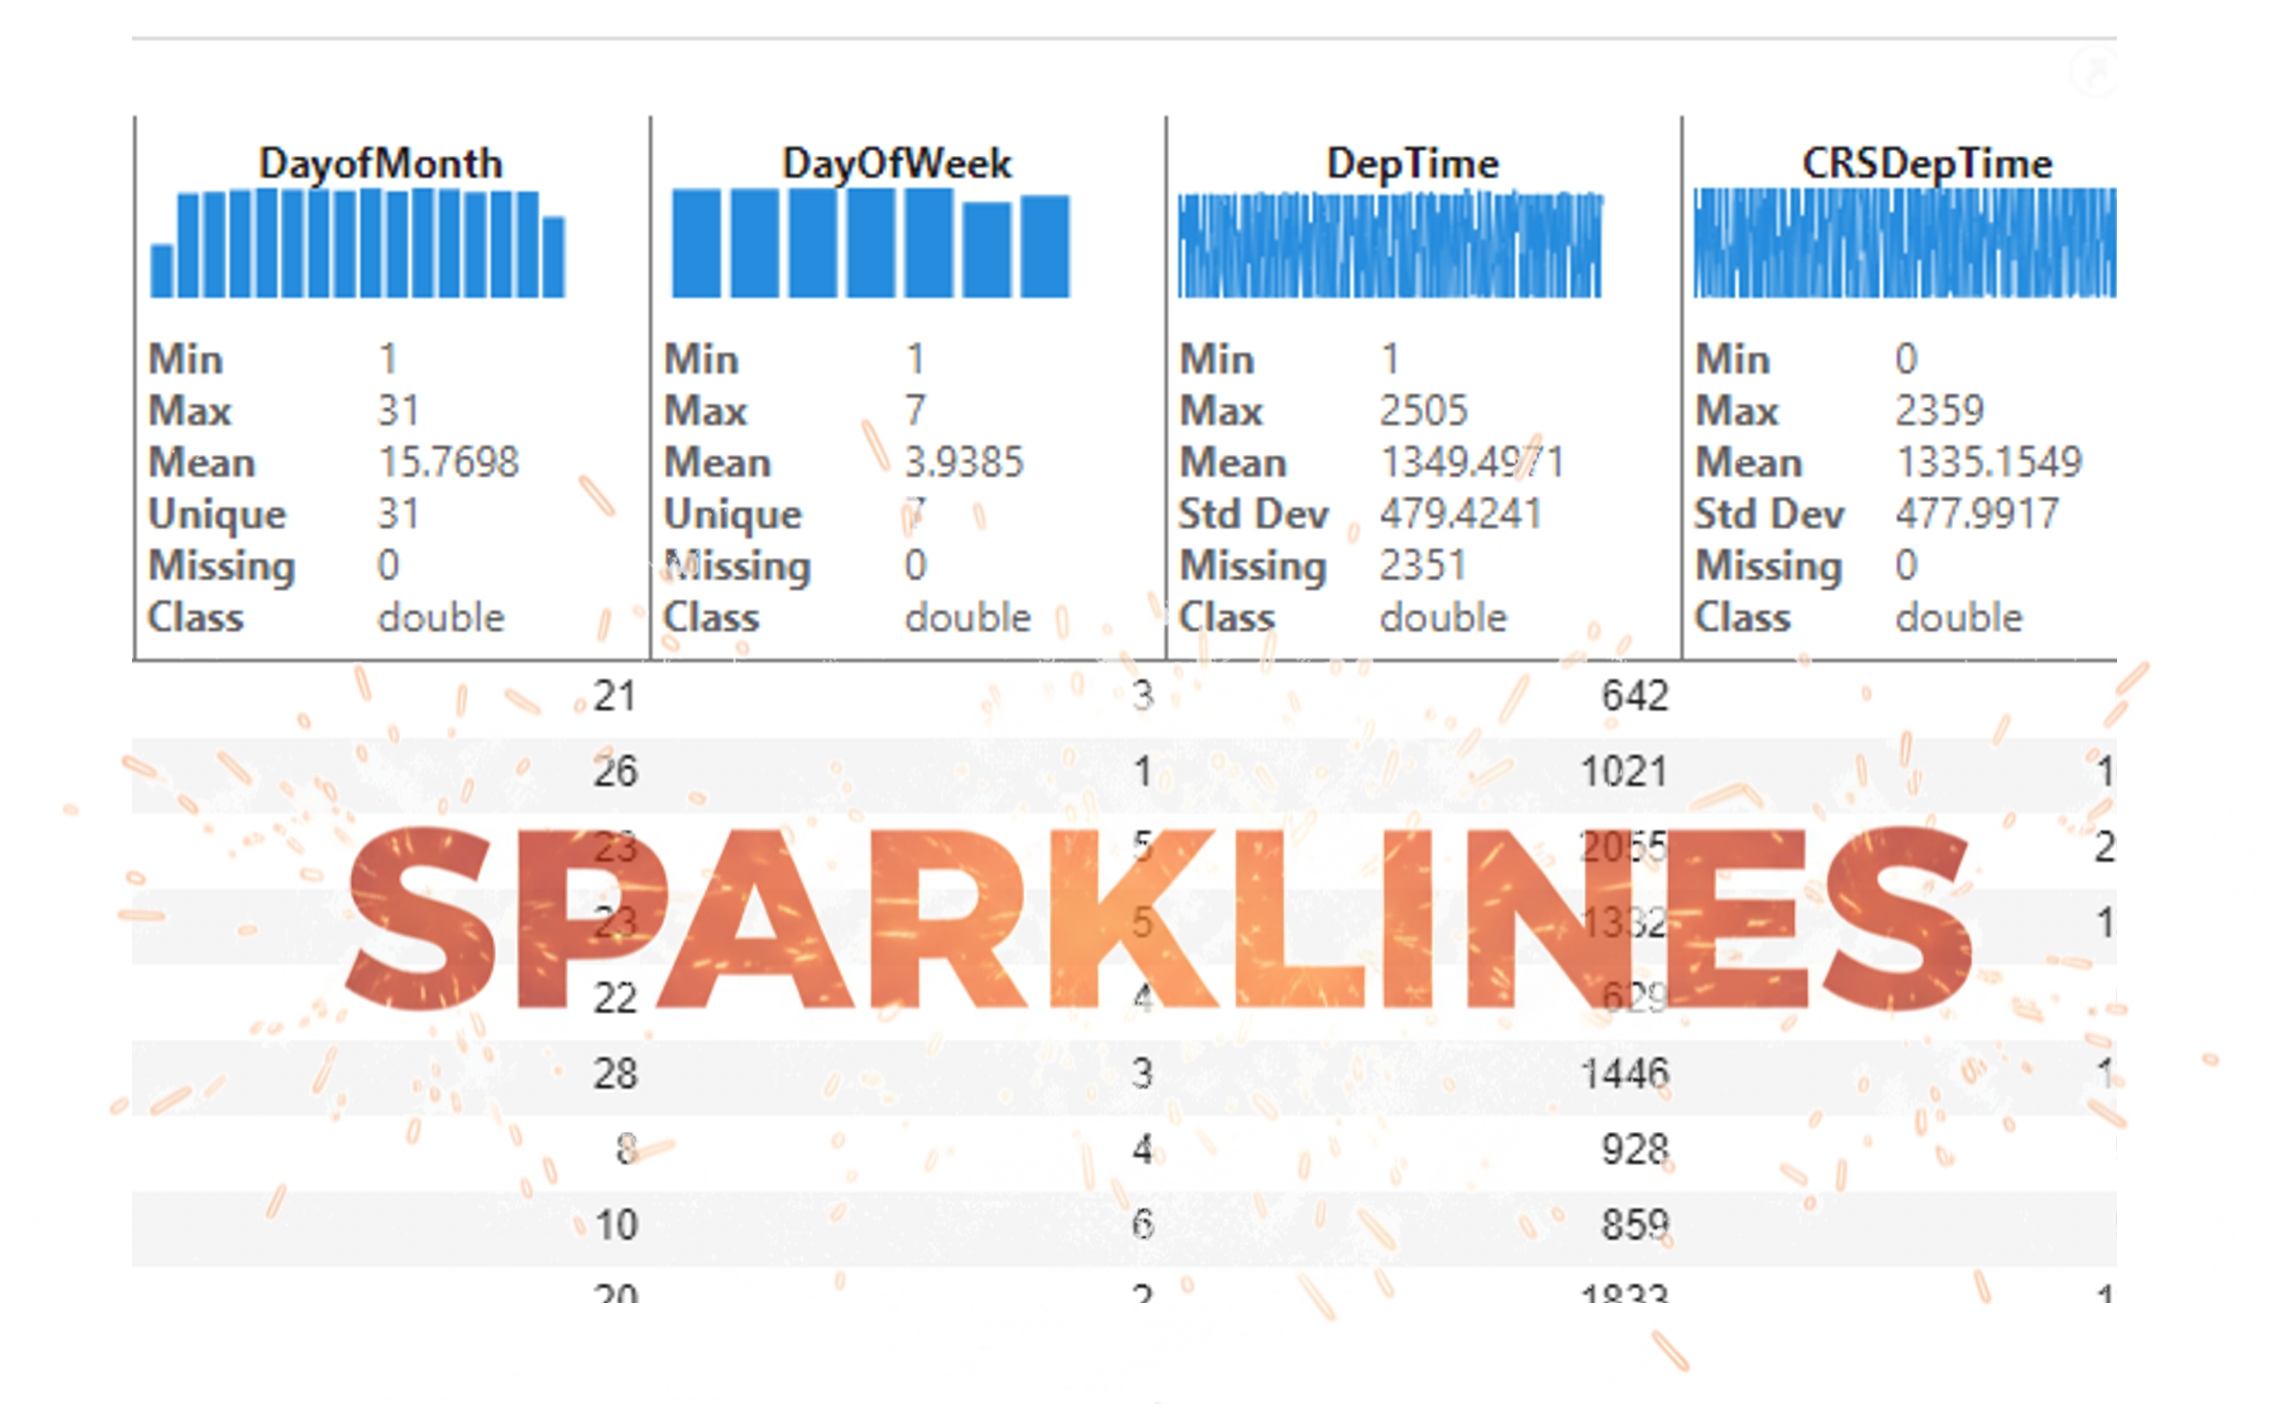
Bob's pick this week is Sparklines Table 1.0 by James Houghton.
While I have not personally studied the methods of Edward Tufte* I have seen some interesting data visualizations over the years based on his work. I emailed a list of colleagues to see who might loan me his book to look up the reference James included in his submission (thanks for that). A common reply was "Which one? I have three" and it turned out the one James cited had two editions. So I am a little surprised there are not more Tufte plots on the File Exchange, but sparklines is a good start.

The basic idea with sparklines is to keep graphics as compact as possible. The combined plots and tabulated statistics are a neat idea. The fact that dozens of them can easily be seen together is an approach that I know will appeal to many.
James makes it clear in his description that this submission is a beginning. His code includes a list of "to do" items for future enhancement. I love the fact that he submitted early stage work. There is so much potential here. Collaboration might be just the ticket for getting more done faster.
*see also edwardtufte.com
- 类别:
- Picks


评论
要发表评论,请点击 此处 登录到您的 MathWorks 帐户或创建一个新帐户。