Labeling an Array of Subplots
Brett's Pick this week is "MTIT: A Pedestrian Major Title Creator", by Us.
If you have the Bioinformatics Toolbox, you may be familiar with the suptitle function, which was originally created as a helper function for an in-Toolbox demo. Additionally, and especially if you've been following this blog for a long time, you may be familiar with Ben Barrowes's Toolbox-independent suplabel, which my predecessor Scott Hirsch selected as a Pick-of-the-Week in June of 2005.
This week, I wanted to feature another entry in the "label-your-subplots" category. Us's mtit is, as we've come to expect, solidly implemented, and the syntax is simple, and, in the output variable, provides easy access to changing the properties of the text-containing axes and the label (text) itself.
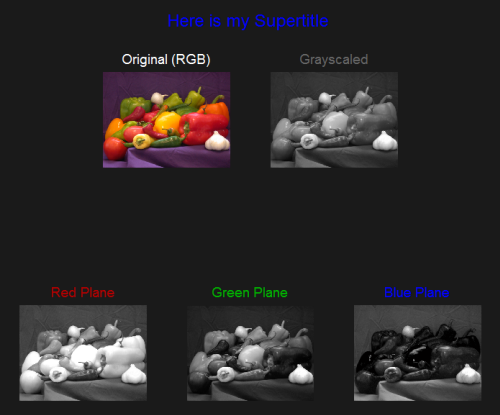
img = imread('peppers.png');
exploreRGB(img,2)
h = mtit('Here is my Supertitle');
set(h.th,'fontsize',18,'color','b')

(Pardon the plug for my own exploreRGB; I find it quite useful when I'm analyzing color images. Consider it lagniappe, and grab it if you'd like!)
- カテゴリ:
- Picks
 Cleve’s Corner: Cleve Moler on Mathematics and Computing
 The MATLAB Blog
 Guy on Simulink
 MATLAB Community
 Artificial Intelligence
 Developer Zone
 Stuart’s MATLAB Videos
 Behind the Headlines
 File Exchange Pick of the Week
 Hans on IoT
 Student Lounge
 MATLAB ユーザーコミュニティー
 Startups, Accelerators, & Entrepreneurs
 Autonomous Systems
 Quantitative Finance
 MATLAB Graphics and App Building


コメント
コメントを残すには、ここ をクリックして MathWorks アカウントにサインインするか新しい MathWorks アカウントを作成します。