Append entries to a legend
Jiro's pick this week is legappend by Chad Greene.
Chad is no stranger to MATLAB Central. He has over 50 File Exchange entries, and two of his entries have been highlighted (unit converters and ccc) in Pick of the Week. His entries are well-written, and like this one, many of his entries have published example files.
Many of you may know that the command legend creates one legend per axes.
t = 0:.1:10;
x1 = sin(t);
x2 = cos(t);
plot(t,x1,t,x2)
legend('Sine','Cosine')
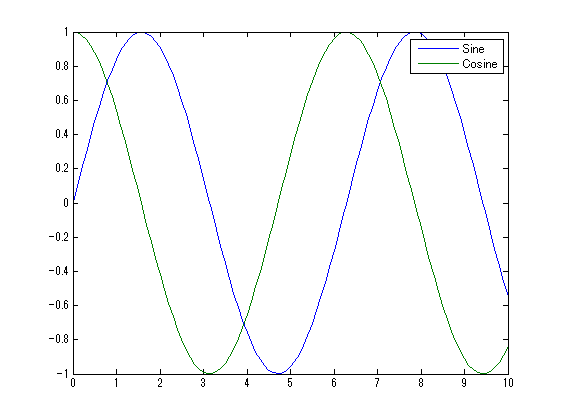
Let's say that you wanted to add another line to this plot.
x3 = sin(t).*cos(t);
hold on
plot(t,x3,'--r')
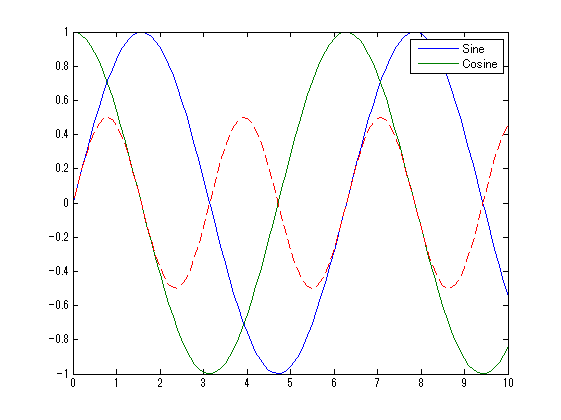
To add this entry to the legend, you would re-run the legend command with the three entries.
legend('Sine','Cosine','Sine*Cosine')
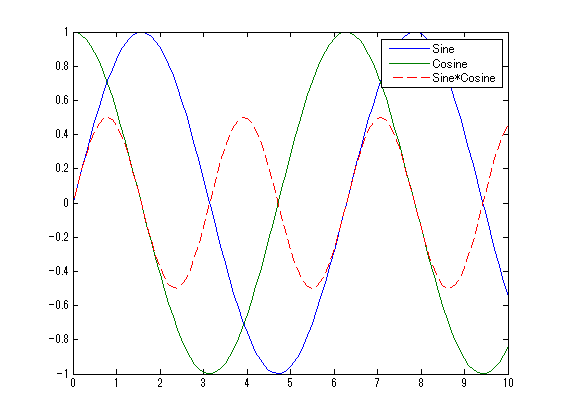
Chad's legappend allows you to append new entries to an existing legend. This means that you can simply call it along with the new lines you create.
% New figure
figure;
plot(t,x1,t,x2)
legend('Sine','Cosine')

% Add another line
hold on
plot(t,x3,'--r')

% Append a new legend item
legappend('Sine*Cosine')
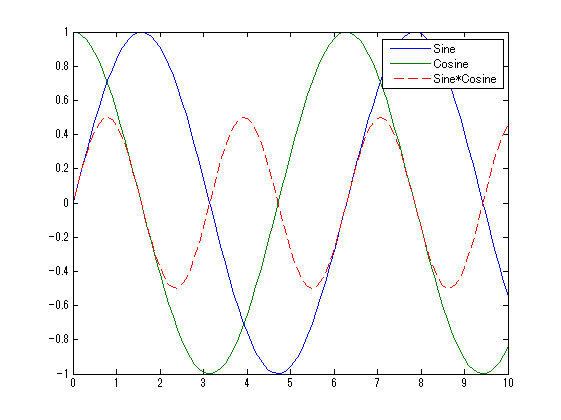
Great! You can also delete the last legend entry with the following command.
legappend('')If you want to see more examples, check out his published example.
Chad explains that legappend simply deletes the current legend and recreates the updated legend. This is a good example of how you can take a normal mode of operation and tweak it in order to adapt it to your needs.
Give it a try and let us know what you think here or leave a comment for Chad.
- Category:
- Picks




Comments
To leave a comment, please click here to sign in to your MathWorks Account or create a new one.