
Programmatically adding data tips
Richard is Consulting Engineer at MathWorks focused on the Embedded Coder product for code generation, primarily in the Aerospace industry.
Richard’s pick this week is add_Data_Tips by Massimo Ciacci.
Contents
Pick
My pick this week is the utility function add_Data_Tips for programmatically adding data tips to multiple lines in a plot.
If you write custom scripts/functions to plot data it is often beneficial to highlight specific points in the plot such as minimums/maximums. Datatips allow you to show the values of the data at selected locations in the figure.

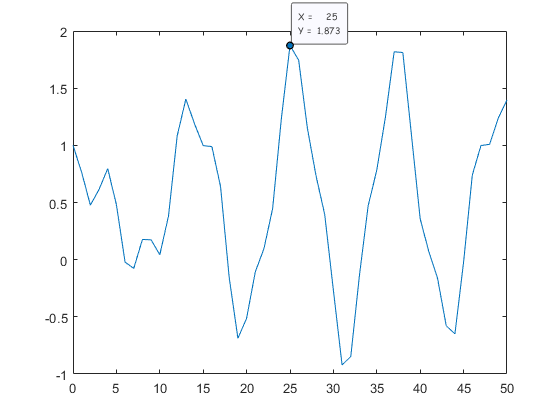
While you can add data tips to a plot manually, it is difficult to add data tips to multiple lines at the same location on the X-axis. add_Data_Tips solves this problem. Using add_Data_Tips, you can insert data tips on multiple lines in a plot at a specified X-axis locations. For instance, if you want to call out the maximum value of a plot, you can use the max function to find the index of the maximum value of the Y-Axis data and specify the corresponding X-Axis data in the call to add_Data_Tips to insert a data tip in the figure at the maximum point.
n = 0:50;
y = cos(.5*(n)).^3 + sin(.3*(n)).^2;
figure
yh = plot(n, y);
[~,indx] = max(y);
add_DataTips( n(indx) , yh, 7)
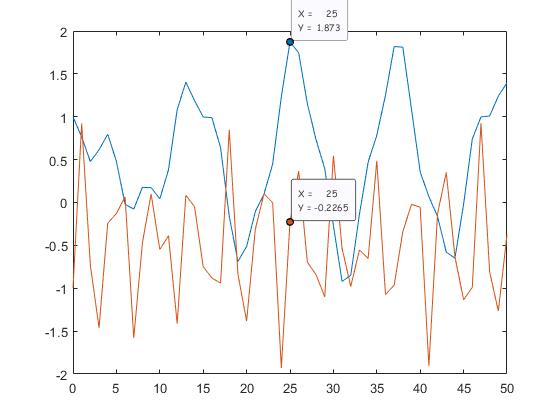
If you have a figure with multiple plots, you can add data tips to any or all of the lines at the same X-Axis location by passing in the handles to the desired lines.
n = 0:50;
y = cos(.5*(n)).^3 + sin(.3*(n)).^2;
figure
yh(1) = plot(n, y);
hold on
y2 = sin(1.5*(n)).^3 - cos(1.3*(n)).^2;
yh(2) = plot(n,y2);
[~,indx] = max(y);
add_DataTips( n(indx) , yh, 7)
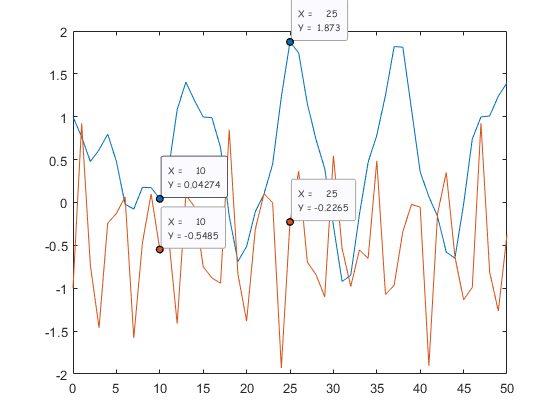
If you already have a plot, you can get the handles to the lines by accessing the Children of the axes
CurrentAxes = gca;
LinesHandles = CurrentAxes.Children;
x_location = 10;
add_DataTips(x_location , LinesHandles, 7)
You can use the examples above or the File Exchange submission includes a demo script, ‘test_add_DataTips.m’, that provides an example.
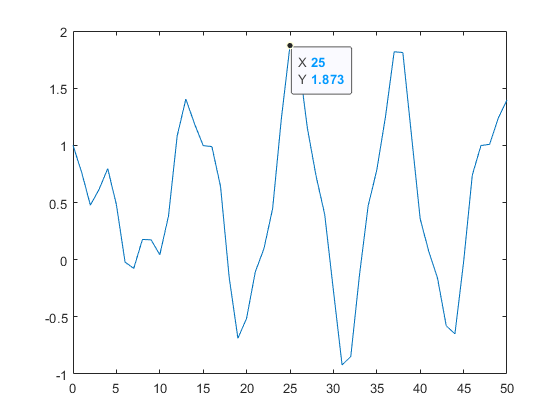
New in R2019b
If you have access to the most recent release, R2019b, you can now programmatically create datatips using the new datatip function.
figure
yh = plot(n, y);
[~,indx] = max(y);
datatip(yh,'DataIndex', indx);
Comments
Give it a try and let us know what you think here or leave a comment for Massimo.
- カテゴリ:
- Picks


コメント
コメントを残すには、ここ をクリックして MathWorks アカウントにサインインするか新しい MathWorks アカウントを作成します。