
Leveraging The Simulink Diagnostics Viewer
I am sure most Simulink users will agree that viewing and analyzing warnings and errors is an important part of working with Simulink models. When simulating models interactively using the play button, all diagnostics are easily noticeable since they appear in the Diagnostics Viewer as they occur.
On the other hand, many users need to run multiple simulations overnight using the sim command, storing the results to MAT-files for future analysis. When doing so, there is no Diagnostics Viewer automatically popping up to inform you that a simulation triggered warnings. This does not mean that you should be ignoring those, even if a warning does not stop a simulation, this is often sign of an actual problem that should be addressed.
In this blog post, I will illustrate how to review warnings from a simulation executed through the sim command, both programmatically and interactively using the Diagnostics Viewer.
Accessing Diagnostics Programmatically
In case you were not aware, all diagnostics are saved in the Simulink.SimulationOutput object, as part of the simulation metadata. Here is an example of how to access this diagnostic information. First, let's load a SimulationOutput object from a MAT-file:
data = load('mySavedData.mat')
and check if it contains any warnings:
data.out.SimulationMetadata.ExecutionInfo.WarningDiagnostics
In this case, we can see that it contains 4 warnings. We can look at the first warning with this line:
data.out.SimulationMetadata.ExecutionInfo.WarningDiagnostics(1).Diagnostic
While this API gives access to all the needed information and allows you to build tooling around it, it can be tedious to type all that to see each warning one by one.
Visualizing Diagnostics in the Diagnostics Viewer
To help with that, a few releases ago (in R2020b) we added a function to display all the diagnostics stored in a SimulationOutput object in the Simulink Diagnostics Viewer, exactly like if you had clicked play in the canvas: sldiagviewer.reportSimulationMetadataDiagnostics.
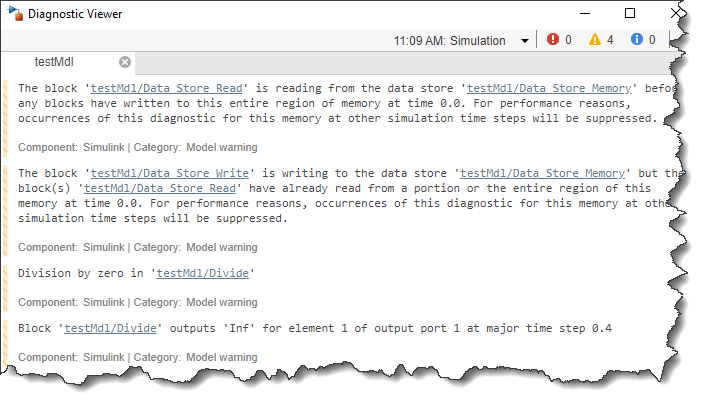
If the model is closed, the Diagnostics Viewer will launch standalone:
sldiagviewer.reportSimulationMetadataDiagnostics(data.out);
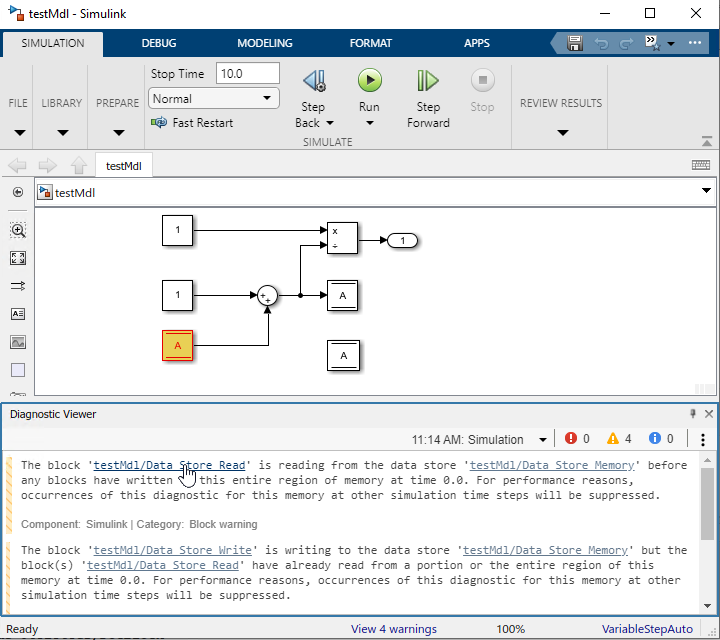
If the model is opened, the Diagnostics Viewer will open docked in the model, as if you had simulated the model using the play button from the toolstrip:
open_system(data.out.SimulationMetadata.ModelInfo.ModelName);
sldiagviewer.reportSimulationMetadataDiagnostics(data.out);
More on the Simulink Diagnostics Viewer
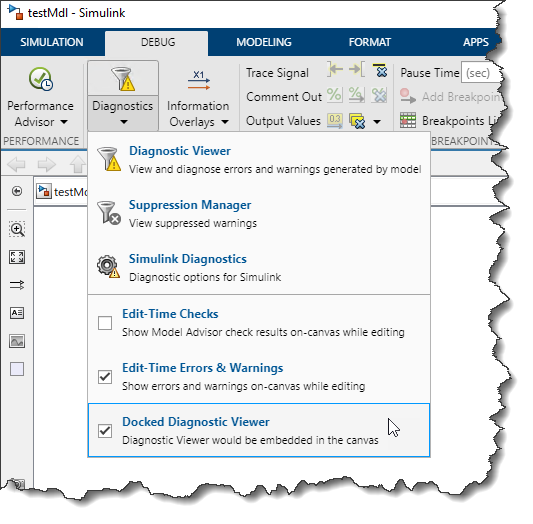
If you are using the latest version of MATLAB (R2021b), you may have noticed that the Diagnostics Viewer is now docked in the Simulink canvas by default. If you prefer to keep it undocked, there is an option that controls this in the Simulink preferences, or under Diagnostics in the Debug tab:
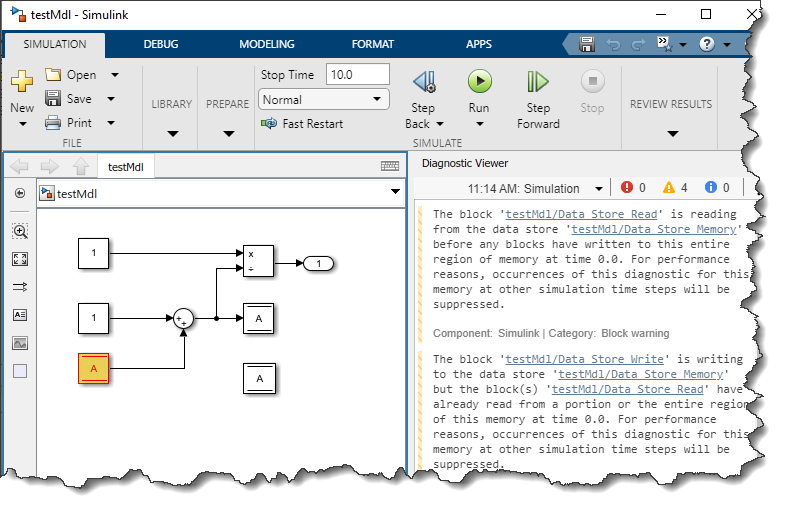
Also, in case you had not noticed, like most panels in the Simulink canvas, the docked Diagnostics Viewer can be moved to the top, bottom, left or right side of the canvas. For example, I often prefer seeing it on the right:
Now it's your turn
In the comments below, I would be curious to hear if you prefer the Diagnostics Viewer docked or undocked, and if docked, where in the canvas you prefer it.
- Category:
- Commands,
- Debugging,
- Simulink Tips


Comments
To leave a comment, please click here to sign in to your MathWorks Account or create a new one.