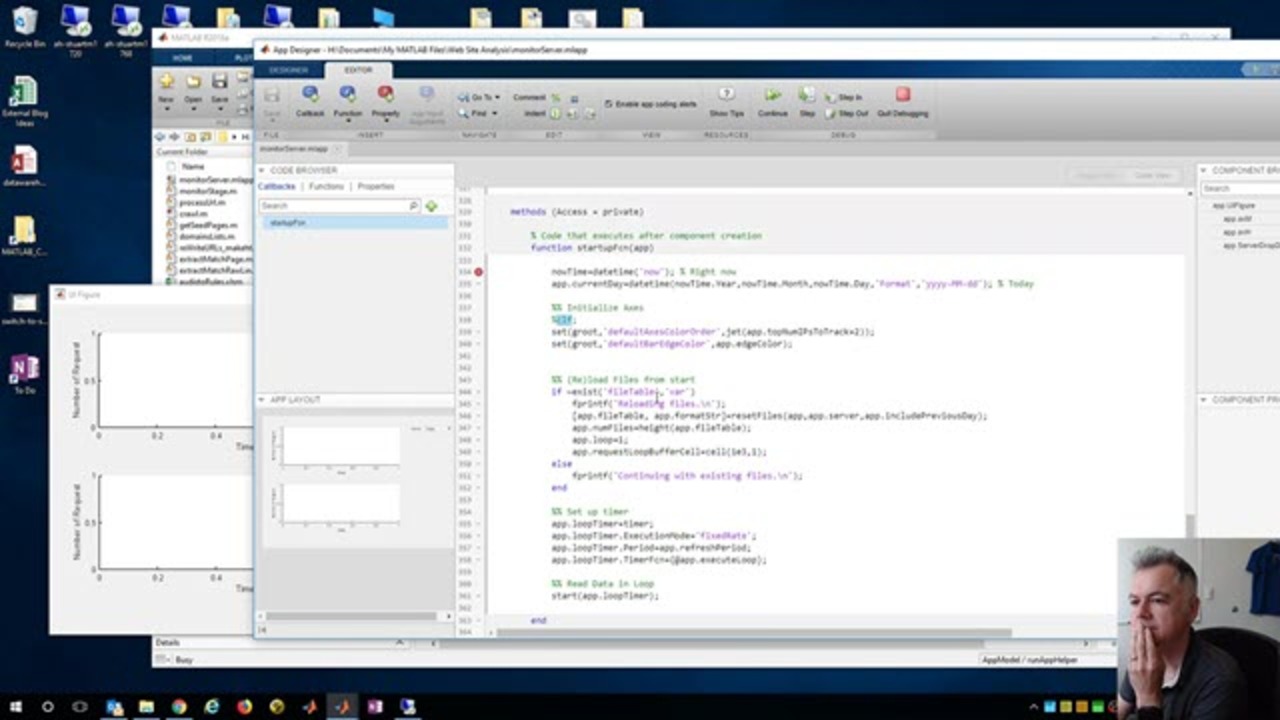
Now that I’ve got most of my data processing and plotting working, I think I can start using App Designer to put it all together. I’m going to move most of the code that I have developed… 更多内容 >>

Now that I’ve got most of my data processing and plotting working, I think I can start using App Designer to put it all together. I’m going to move most of the code that I have developed… 更多内容 >>
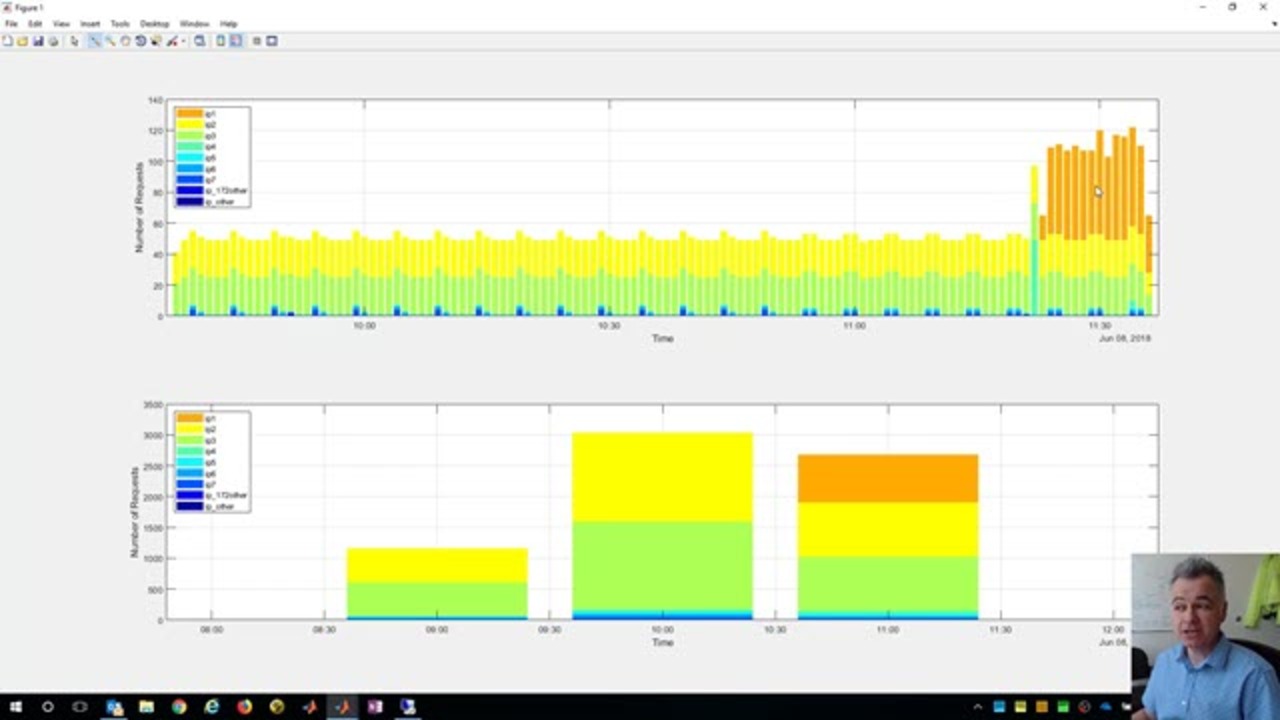
So far I have some charts displaying my server traffic in a while loop. Next, I think I want to execute the chart updates at a regular rate, so I’m going to move the contents of the loop into a… 更多内容 >>
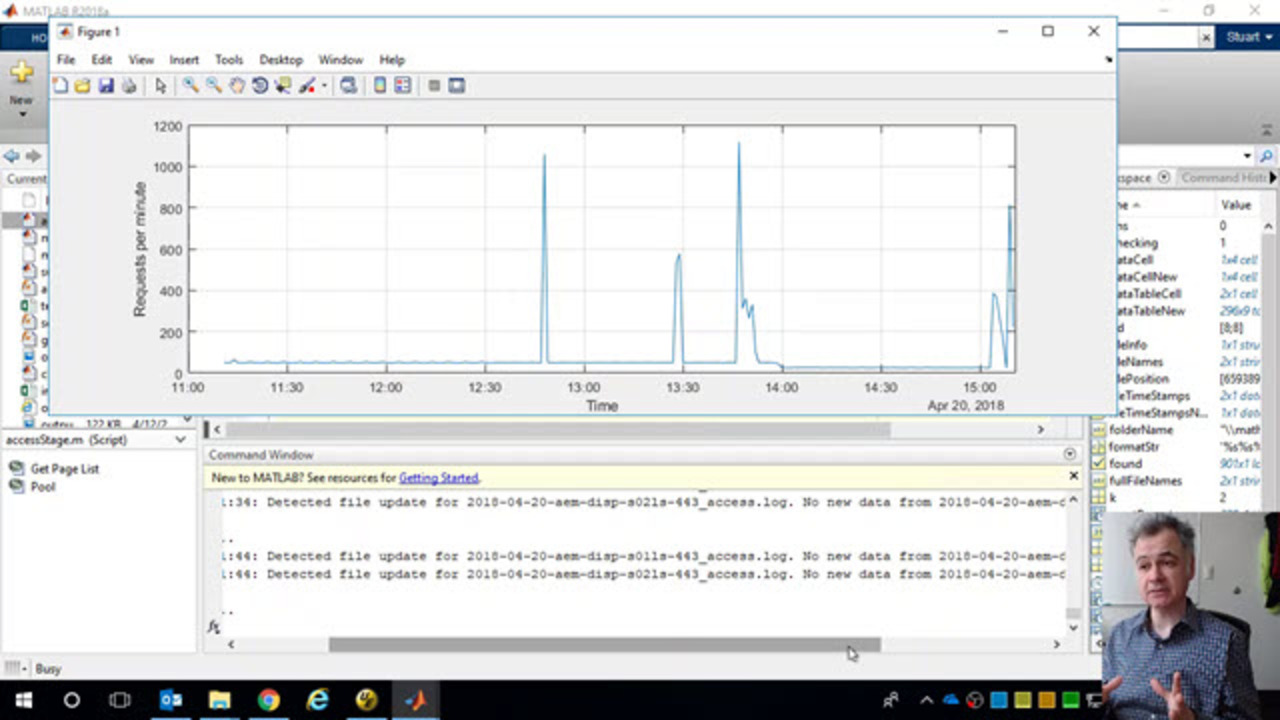
In my last post, I worked on accessing a set of continually updating log files from a server. Here I will review what I did to tidy up my code, then work on plotting the streaming data as it comes… 更多内容 >>
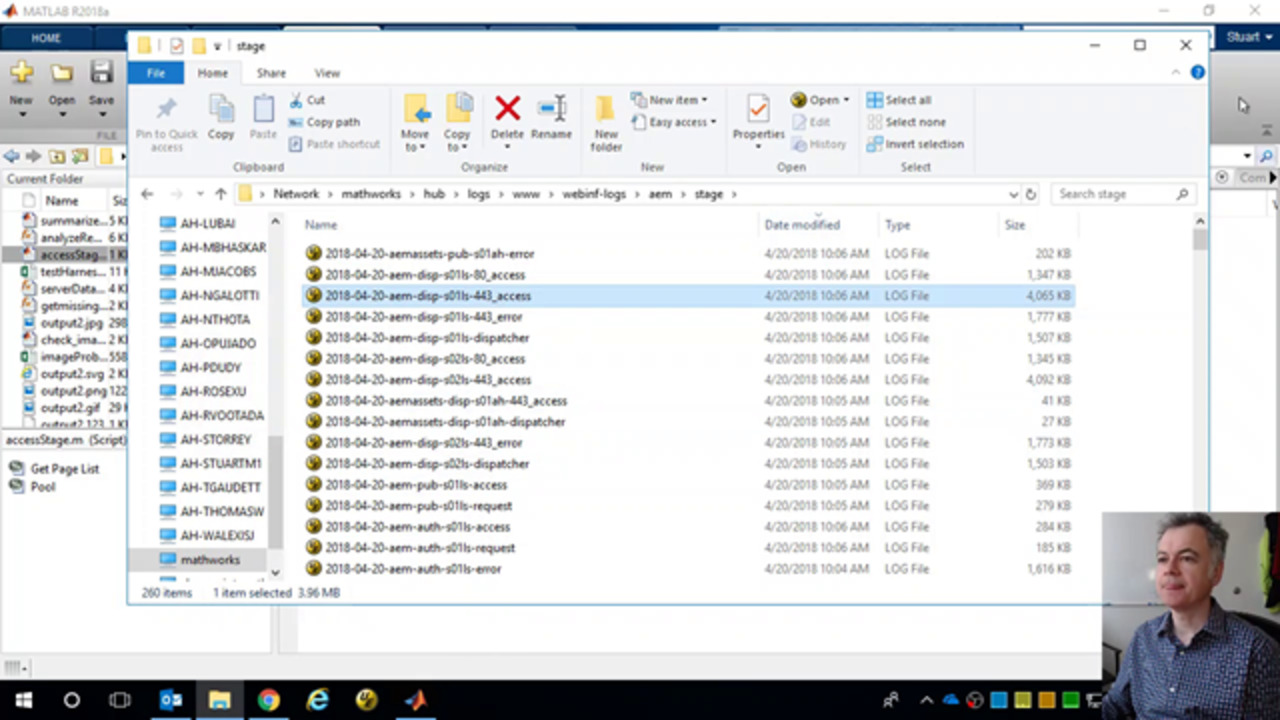
This will be one of a few posts where I work on building an app that will visualize traffic to a web server, letting me monitor it as its being used. I plan to use App Designer, then deploy the app… 更多内容 >>
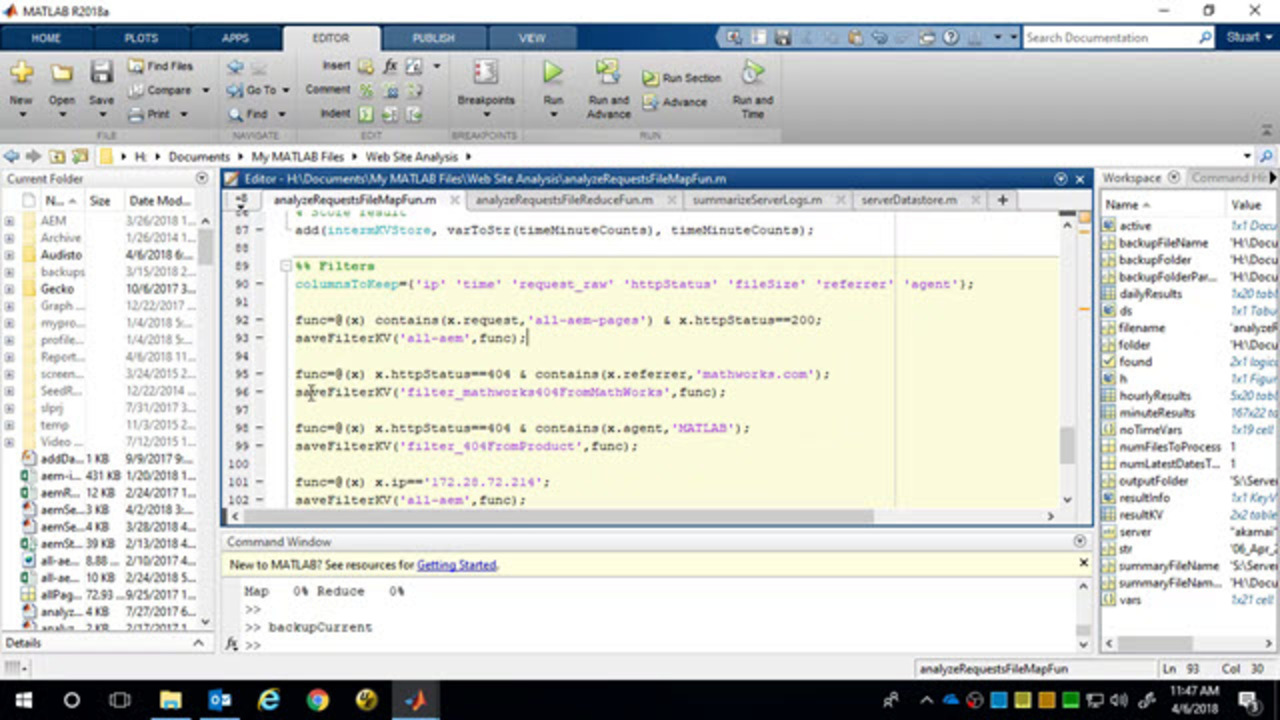
Here I restructure the section of my code that filters the requests, so I can easily add any filter rule (as an anonymous function) in the future. Once again I forgot to turn on my webcam so you… 更多内容 >>
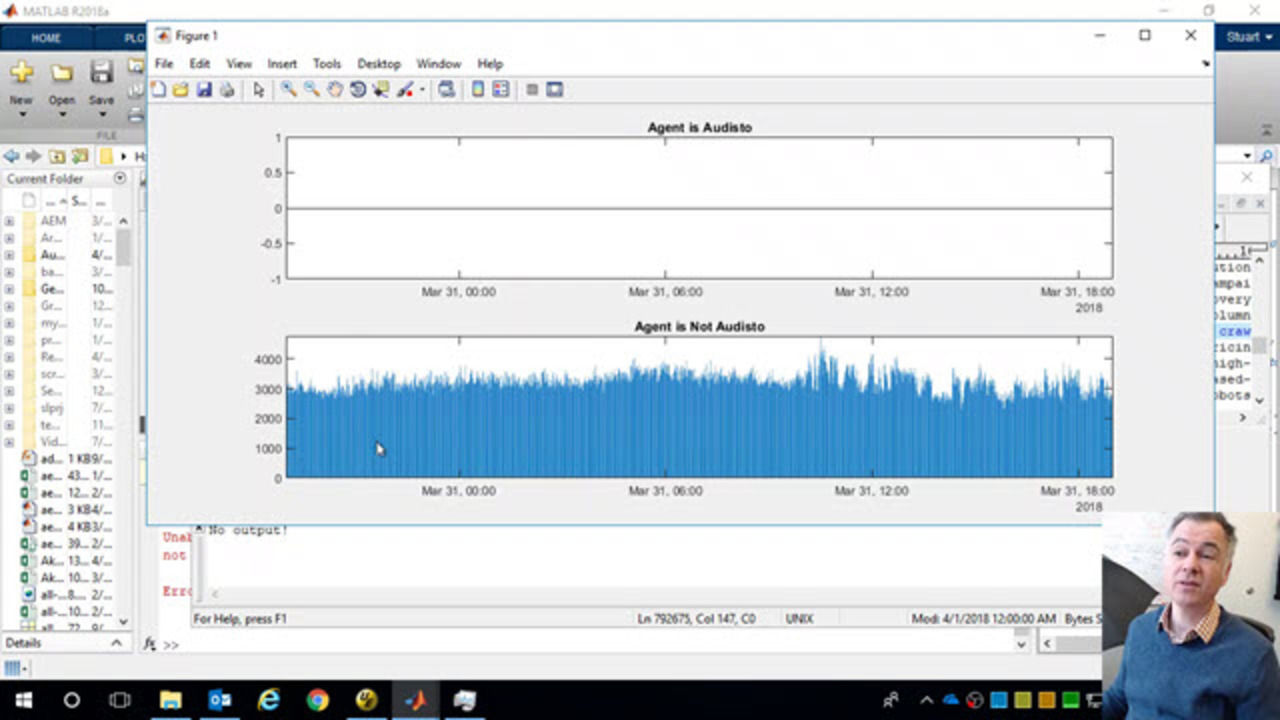
Here I continue with my analysis of the log files of a different server. I need to modify my map function to create some variables and strip some rows which I am not able to do during file… 更多内容 >>
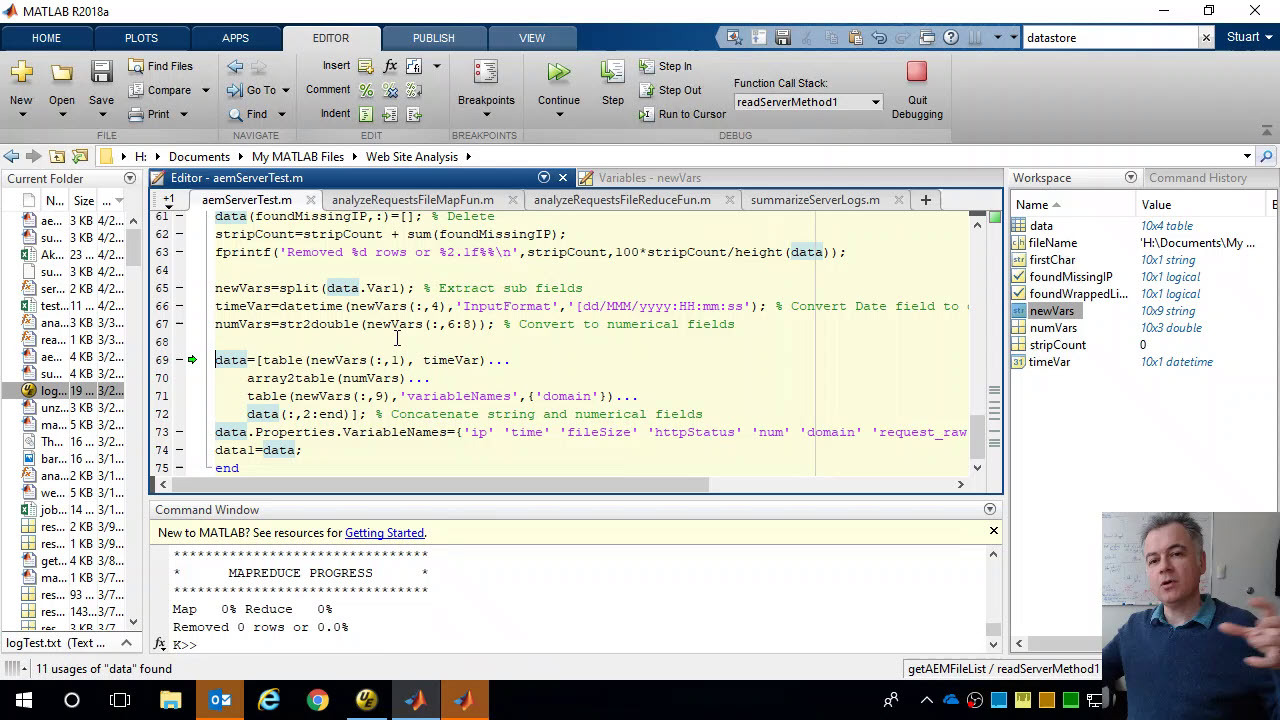
I want to carryout the analysis I did in my previous post on another server. However, that server has a different log file format. So I decide to make a parameterizable function that can return a… 更多内容 >>
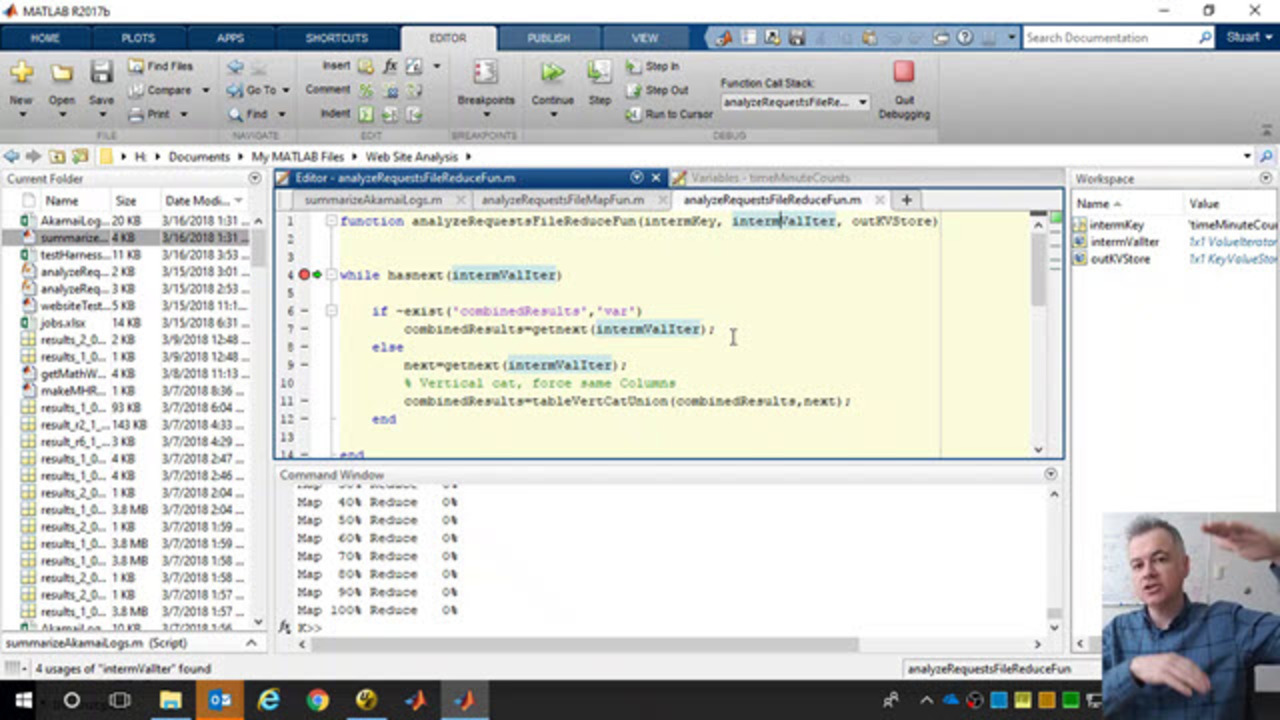
Here I’m using the MapReduce functionality in Parallel Processing Toolbox to process several hundred GBs of server logs from our web site. I want to be able to visualize the counts per minute… 更多内容 >>

Here I show how the new arithmetic expansion rules in release 16b can be used to answer a blog post comment question. See the great post by Loren on the subject.
Features covered in this video… 更多内容 >>
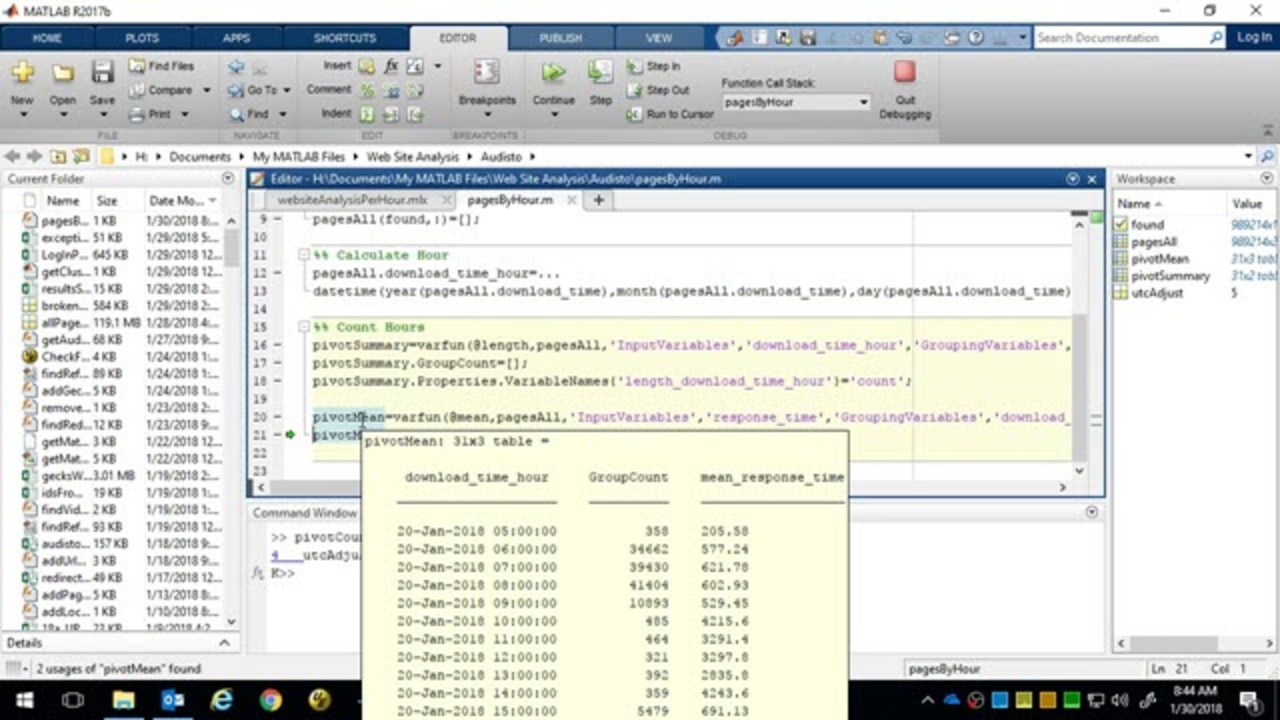
Here I take the analysis I did in this post to group website crawl data by the hour, and incorporate it into another function that runs daily. I forgot to turn on my webcam for this one, so its just… 更多内容 >>