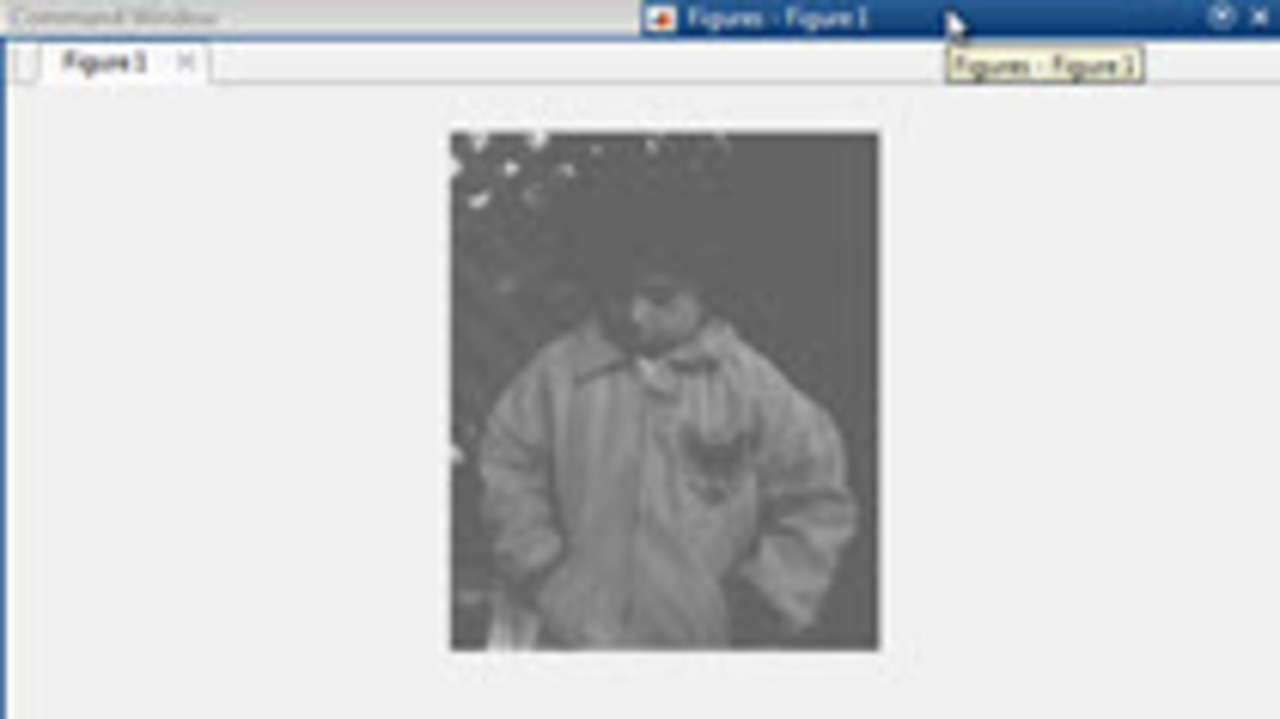
A MATLAB user on MATLAB Answers wanted to know how to change all the pixels in an image that were below a certain threshold. The answer was correct, but very terse. I wanted to expand upon the… 更多内容 >>

A MATLAB user on MATLAB Answers wanted to know how to change all the pixels in an image that were below a certain threshold. The answer was correct, but very terse. I wanted to expand upon the… 更多内容 >>
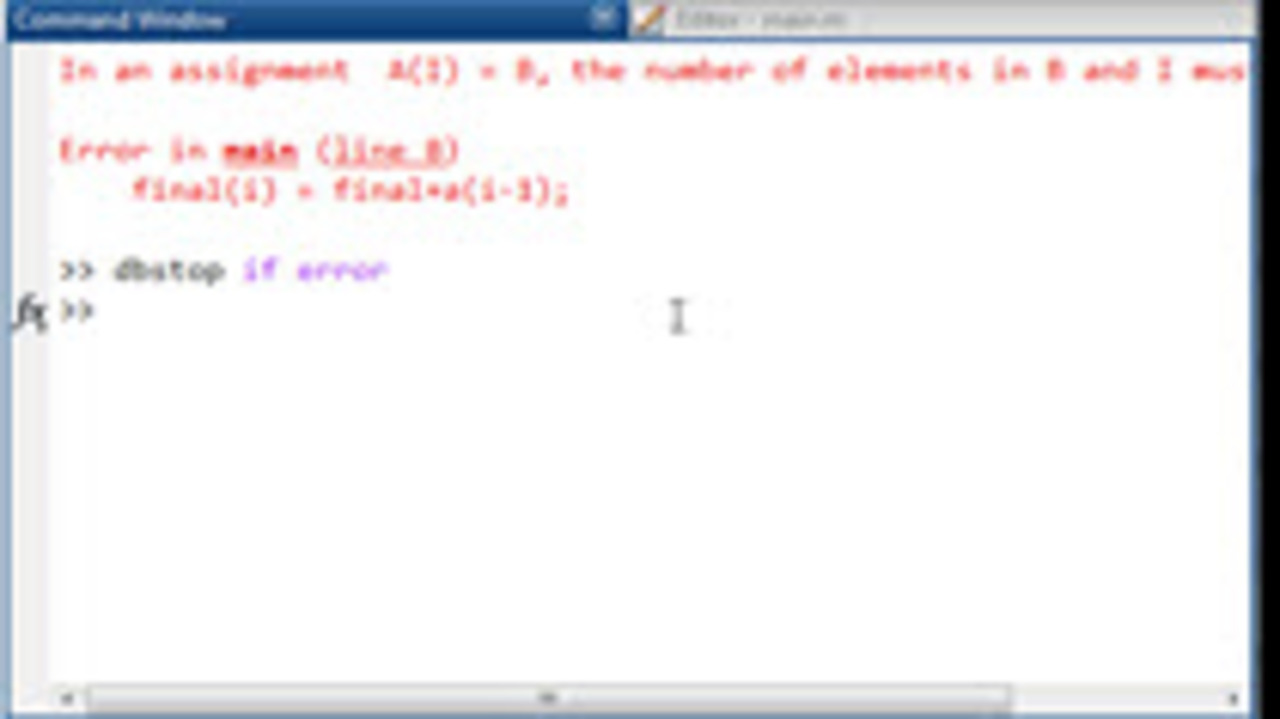
The very common MATLAB error: “In an assignment A(I) = B, the number of elements in B and I must be the same.” occurs when one side of an assignment has a dfferent dimension than the… 更多内容 >>
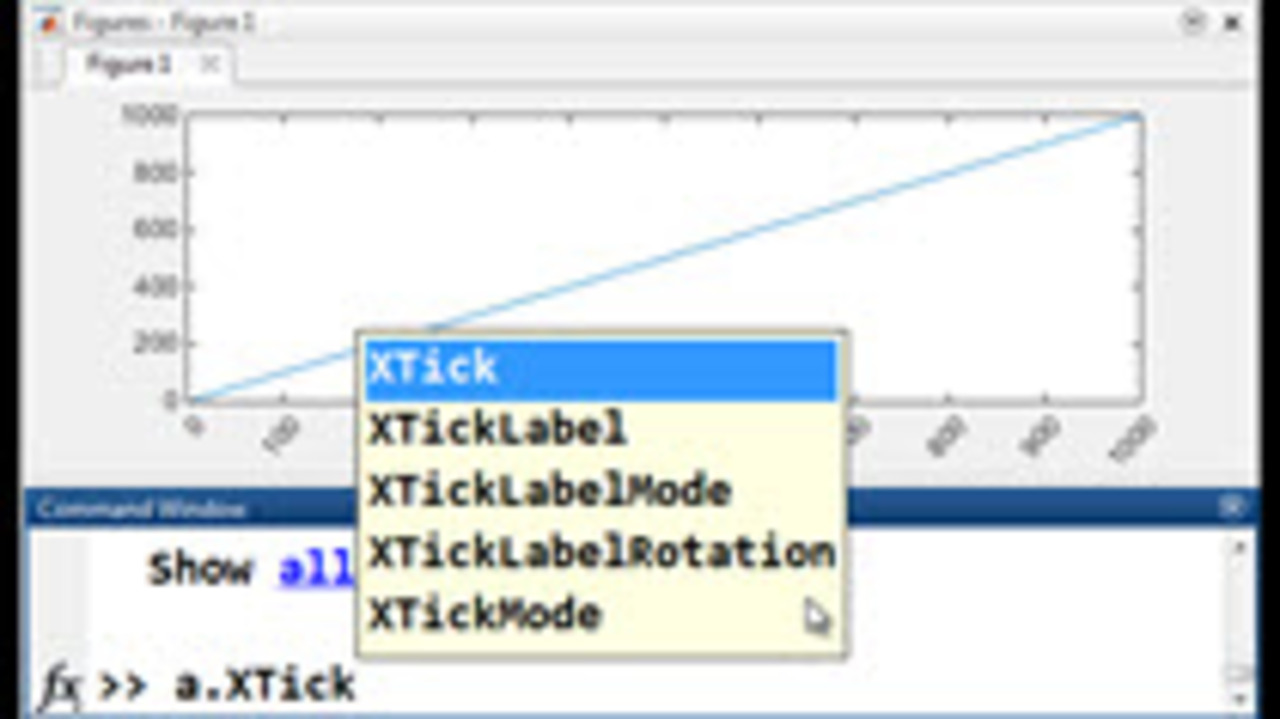
The new release of MATLAB R2014b brings a new graphics engine. This allows for some new capabilities such as rotating tick labels and using dot notation in referencing graphics properties. These… 更多内容 >>
When you have timers and callbacks in your code, it can be difficult to find out when certain errors are occuring. Use DBstack to find the debug stack trace in MATLAB. This will allow you to find… 更多内容 >>
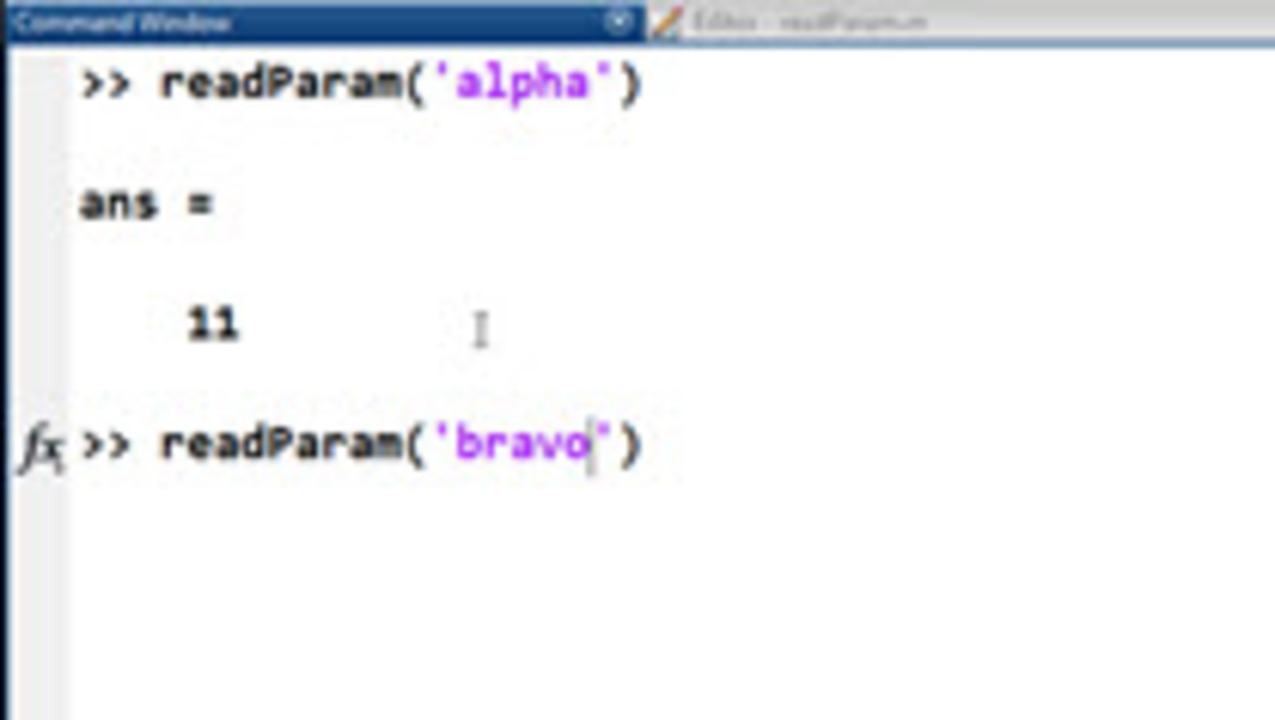
In last week’s post, I showed how to generate code in MATLAB to automatically read in a file. In this video I show how to make a simple wrapper function around code generated in that way. … 更多内容 >>

I recently was asked how to import from Excel but only bring in a certain part of the file. You might want to do this if you have headers or just want a small part of the spreadsheet to come into… 更多内容 >>
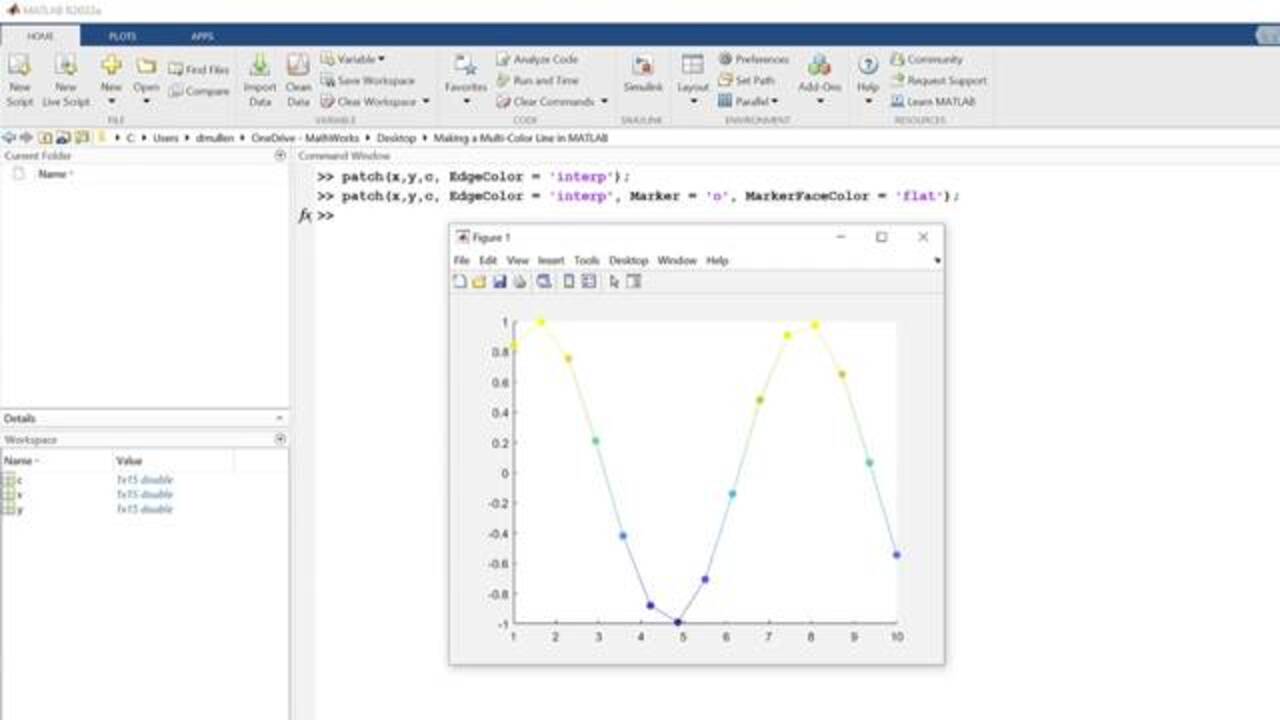
This video is a follow on to last week’s. Instead of making a line with different colored markers in MATLAB, we will be making a multi-color line in MATLAB. This is actually stretchig the… 更多内容 >>
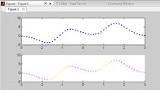
MATLAB Answers is a great resource for getting help from the MATLAB community. There was a recent question that inspired this video. I took the question to mean, how can I change the color of a… 更多内容 >>
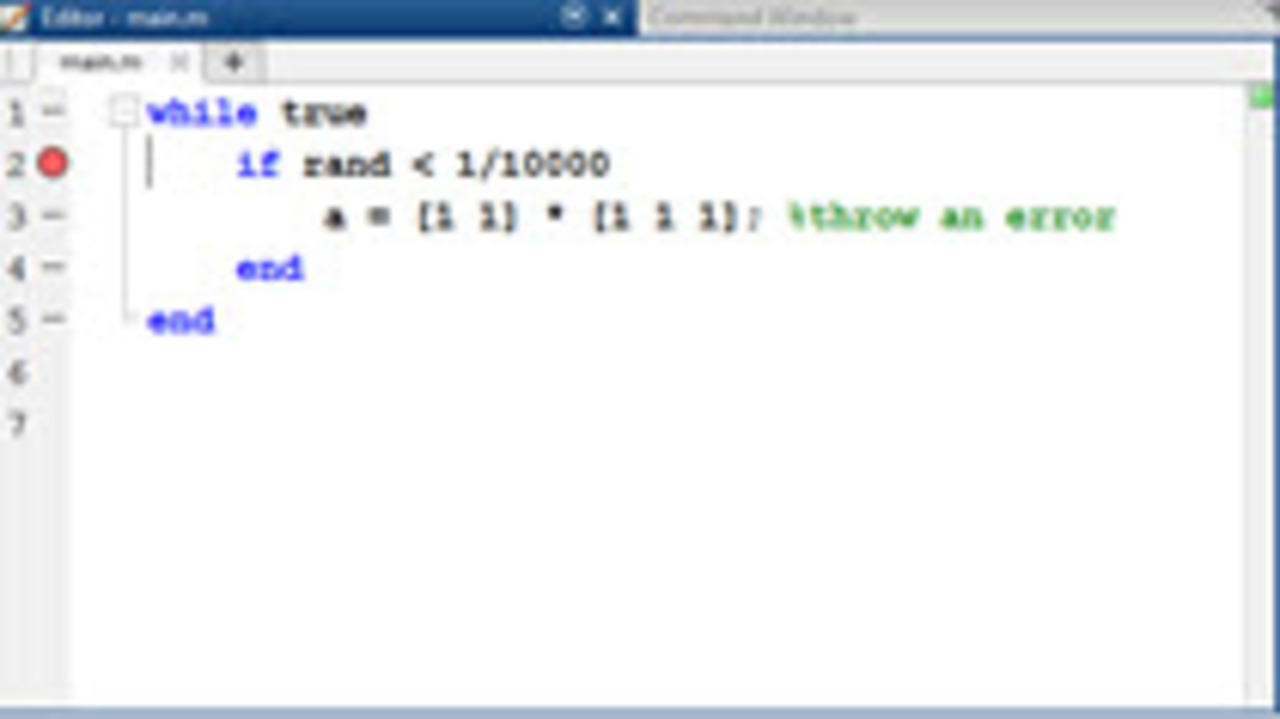
Some errors happen in MATLAB infrequently. If you don’t know the conditions when they occur, setting a breakpoint might not work. Using DBSTOP if error will have MATLAB stop on a line in the… 更多内容 >>
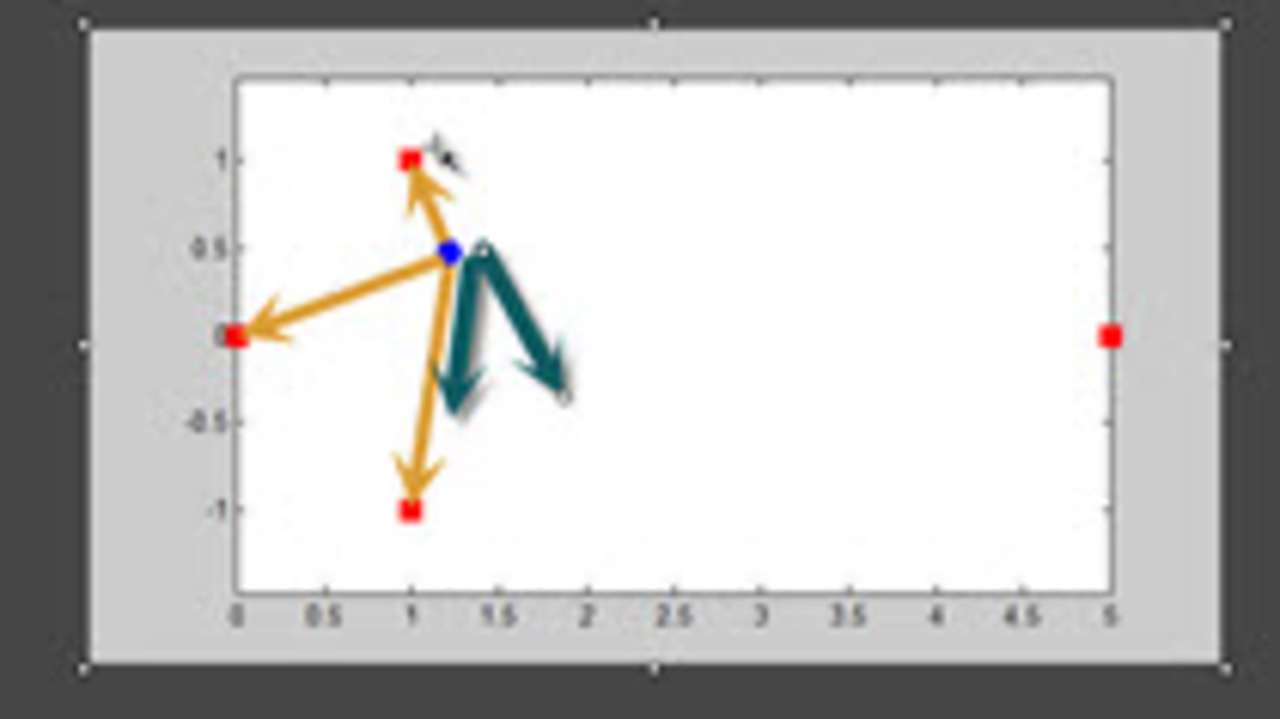
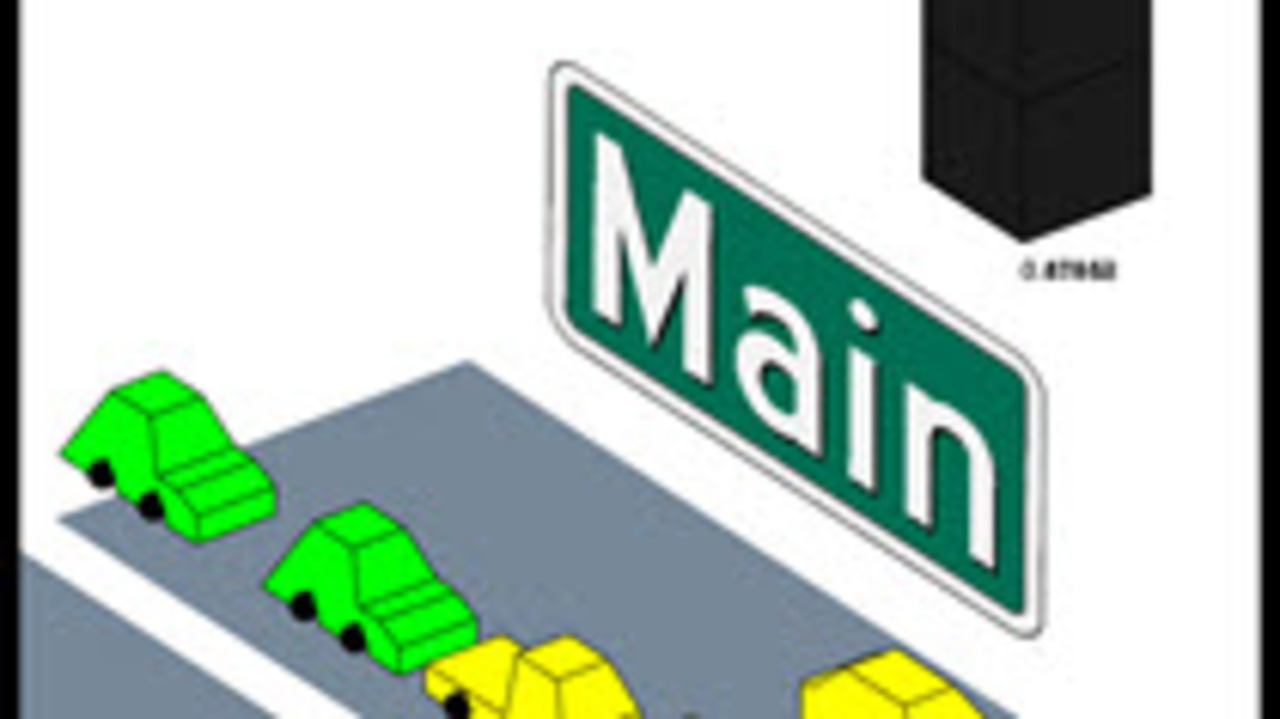
When we design a program, the way we store our data will have an effect on how our code looks as we manipulate that data later. In this video we had the choice to store the coordinates of a robot… 更多内容 >>
