Skip to Main Content Skip to Search
File Exchange
MATLAB Newsgroup
Link Exchange
  Blogs  
 Contest 
MathWorks.com

Loren on the Art of MATLAB

October 5th, 2006

Code Generation from Import Wizard

Some colleagues and I were talking to some customers recently at a seminar and asked them what some of their favorite new features are. One of the top ones is being able to generate code from the Import Wizard.

Contents

What is the Import Wizard?

Some of you may ask what the Import Wizard is. It's a graphical tool that allows you to load in data to MATLAB without knowing the explicit format of the data. For some projects, you may have many data files with consistent formats, but you don't necessarily know the format until you look at a representative file. With the Import Wizard, you can read in the first data set the way you'd like and generate code for the process. Now you can use the generated M-file to automate importing additional files for future processing.

Working with External Data

In a recent post, I converted a collection of .mat-files containing audio data to a set of .wav files. Since MATLAB already contains wavread for reading in wav-files, we can automate reading in this sort of data already. But suppose instead we had a set of spreadsheets, each containing two columns of data, with headers time and temperature. We could certainly use xlsread, but it would be a bit of work and programming to get the data into two variables named time and temperature.

Using the Import Wizard

Instead, I can use the import wizard to help figure out how I want to represent the data. Let's see what the wizard looks like for the first file: timetempPHX.xls.

You can see that I can read the data in, with column names and other text data placed into cells. I can also read the data into variables, with the column names becoming the variable names in MATLAB.

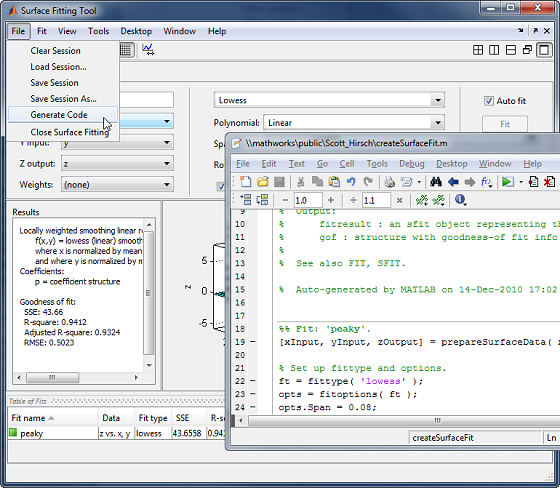
Now look in the lower right corner and you will see a check box that I now select to generate code for this dataset.

After the code is generated, I save the file as importfileTimeTemp.m.

Using the Generated Code

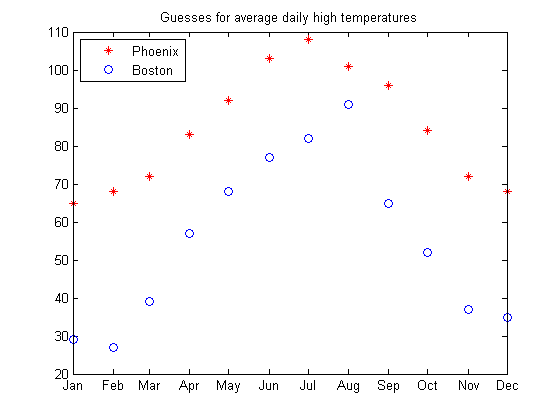
Now I can read in these files in a more automated way, allowing me to script some analysis. We'll load two such datasets and plot them on the same figure to compare fabricated monthly average high temperatures for a year in Boston and Phoenix.

importfileTimeTemp timetempPHX.xls

Convert months into the correct format for the year 2005.

date = datenum(2005,month,1);
ticks = cumsum([min(date) 31 28 31 30 31 30 31 31 30 31 30]);

Plot the first data set, set x-axis ticks correctly, then get and plot the second set of data. Finally, add a legend and title.

plot(date,temperature,'r*')
set(gca,'Xtick',ticks)
datetick('x',3,'keepticks')
importfileTimeTemp timetempBOS.xls
hold on
plot(date,temperature,'bo')
title('Guesses for average daily high temperatures')
legend({'Phoenix' 'Boston'},'location','northwest')
hold off

What Features Work Well for You?

In the past couple of blog articles, I have tried to show you some of the features new to R2006b. Which features solve a problem for you? Let me know.


Published with MATLAB® 7.3

4 Responses to “Code Generation from Import Wizard”

  1. Maik replied on :

    Hello,

    thank you for the idea to define the ticks by hand.
    like: ticks = cumsum([min(date) 31 28 31 30 31 30 31 31 30 31 30]);

    But when I changed my time horizon it did not work out.
    Then I looked into the datevec() function.
    Now it was easy to ask for the beginning of the month and take this as the datenum() for the ticks.
    Then using datetick and your scale on monthly basis is right!

    Here is my code example:

    tm0=0;tmE=0;
    t1 = datenum(num2str(200304010000),’yyyymmddHHMM’);
    t2 = datenum(num2str(200311010000),’yyyymmddHHMM’);
    for n=1:length(Qm_ho(:,1)),
    if (Qm_ho(n,1)== t1)
    tm0 = n;
    end
    if Qm_ho(n,1)== t2
    tmE = n;
    end
    end
    tm0
    tmE

    %ticks definitions for dates
    alldates = Qm_ho(tm0:tmE,1);
    dtick =[];
    for f=1:24:length(alldates)
    dv=datevec(alldates(f));
    if dv(3)==1
    dtick=[dtick alldates(f)];
    end
    end
    datevec(dtick)
    %use dtick for ticking the x axis

  2. Claudia Hofemann replied on :

    Hi Loren,
    I am using the Import Wizard, to import .dat files. Afterwards I am splitting them into x, y and z coordinates and I would like to compare this matrices or let’s say the average of the xx with the xx coordinates out of another picture (I have about 100 for each set).

    My files are quite big. The whole .dat file has 1431040×3 double numbers the reshaped about 1377×1040 double values inside.

    It would be perfect if you could give me an advice.

    Claudia

  3. Musumpuka Remmy replied on :

    hello there! am new to matlab and am working with wave files,
    I need help on how i can import a number of wave files into matlab!
    currently am using wavread(’2004-020-074500.wav’) for example
    where “2004-020-074500.wav” is just the filename! now i have more than just a file and i would like to automate the wavreading! kindly help!

    Remmy

  4. Loren replied on :

    Remmy-

    Please see this blog to answer you question on how to process files. In your case, you will need to be careful to assign valid variable names to your data when you read it — it can’t be in the form of your current file names. You might want to look at genvarname.

    –Loren

Leave a Reply


Loren Shure works on design of the MATLAB language at The MathWorks. She writes here about once a week on MATLAB programming and related topics.

  • Ulla Vainio: That error bar width adjustment was extremely useful and I would never have figured it out myself....
  • Peter Perkins: Jessee, there is a property that you can use to tag variables with units. For example, >> load...
  • Jessee: I could potentially see myself using dataset for casually looking at data, but from an application standpoint...
  • Loren: Oktay- It very much depends on the details of the calculations you are doing. Vectorization can sometimes...
  • Oktay: Hello, Is there any significant difference between using: - Vectorization inside a subfunction - Benefiting...
  • Loren: Clare- Yes, sum can sum a double vector: x = [.3 .4 pi/3] y = sum(x) x = 0.3 0.4 1.0472 y = 1.7472 You must...
  • Clare J: R2007a - Student Version When I use sum to sum a vector of type double I get this error message: ???...
  • Sarah Zaranek: Hi Jacob, Sorry about the slow response. You are correct that the code would be slower without the...
  • Navaneethan Santhanam: Thanks a lot, Loren! That worked perfectly.
  • Mike N: Should it be OK to use “persistent 221; variables in a deployed application? What if I have two...

These postings are the author's and don't necessarily represent the opinions of The MathWorks.

Related Topics