
Plotting confidence intervals
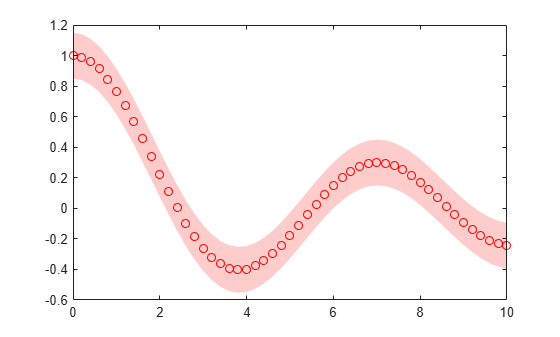
This week's pick is a fairly simple, but quite useful, submission. Michele Giugliano's CONFPLOT picks up where ERRORBAR leaves off. While ERRORBAR is great for fairly small data sets, it doesn't scale well for dense or continuous data. CONFPLOT adds continuously varying bounds to your plot.
The results are quite aesthetically pleasing, suitable for presentation to very important people! People will be sure to trust results that look this good, no matter how bogus your data might be ("It must be legit - he shows confidence intervals.")
Michele did a very nice job writing the documentation with the standard MATLAB syntax, which makes it very easy to read. One caution - if you want to run the test file provided with the submission, be sure to download Michele's SLIDINGAVG from the File Exchange.


See Also
-

PLOTREGION
Blogs
-

Distribution Plot
Blogs
-

Shaded Error Bars
Blogs


Comments
To leave a comment, please click here to sign in to your MathWorks Account or create a new one.