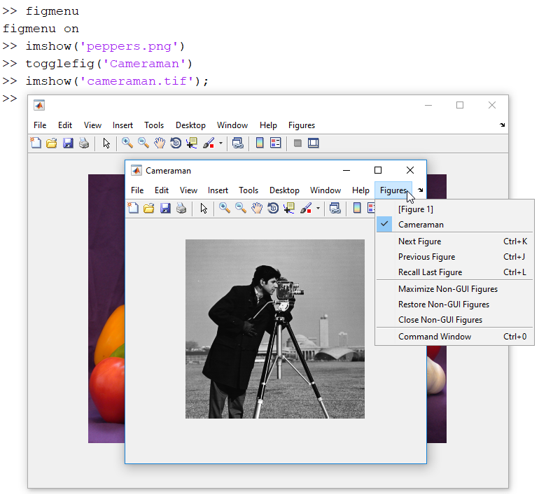
File Exchange Pick of the Week

October 7th, 2005

Figures Stay on Top

Figure windows are the eyes that you look at your data with. However, if you are iterating on a graph, every time you type a command, MATLAB's desktop comes to the top and your figured gets hidden. We at The MathWorks have tried to solve that by making figured dockable, meaning they become embedded in the desktop like the editor windows are. However, it is always nice to have two ways to do something. This week's pick is a file that was written in C, and then made into a DLL that can be called from MATLAB. This was done with MEX files (MATLAB executable file).

Comments are closed.


Bob, Brett & Jiro share their favorite user-contributed submissions from the File Exchange.

  • Zach: Hi Doug and Les, I didn’t have a lot of time to mess with this, but I did find a work-around. I plotted...
  • hamed: k
  • Les: @Zach This isn’t exactly what you are looking for but at least it puts all three parameters on the same...
  • Zach: Thanks for your suggestions Doug. I’ll give that a shot and see what happens. I’ve seen many of...
  • Doug: @Zach, I would say to use plotYYY, because that is close to what you want, but using depth as Y makes sense....
  • Doug: @Teja, I think this will work: http://www.mathworks .com/access/helpdesk /help/techdoc/ref...
  • Gify: merry christmas :) nice christmas tree! Regards, Janet Gify
  • Teja: Dear Doug Is there anyway to plot a surface from nonuniform data without meshgrid and griddata? Basically i...
  • Zach: I’m working with geophysical data, so I’d like to produce a depth profile. The y-axis would be...
  • Doug: @Ashok First, please do not use variable names that are MATLAB commands (std and mean). Second, p(j) should be...

These postings are the author's and don't necessarily represent the opinions of The MathWorks.