File Exchange Pick of the Week

July 27th, 2007

Shading plots for emphasis

shading.jpg

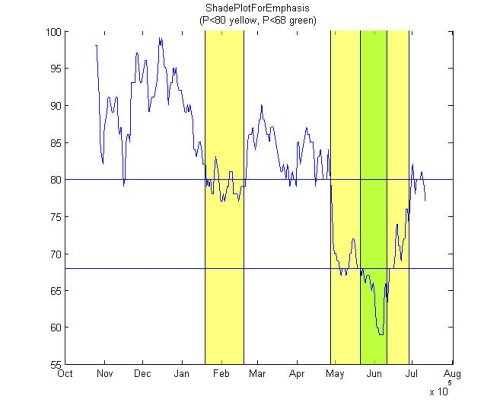
Sometimes showing the data in a plot is just not enough. You need to be able to emphasize the parts that are the most important for the viewer of the plot. ShadePlotForEmphasis will do just that.

I like that this function comes with useful help, and a demo and that Michael kept the syntax very concise:


G={today-[30 51]};
ShadePlotForEmpahsis(G,'g',0.5);

20 Responses to “Shading plots for emphasis”

  1. Eric Magee replied on :

    This is great. The one thing I did find is that the transparency behaviour for patch (and fill) is different when the axes are logarithmic (at least in 2006b). When the axes are linear, the lines and the grids are visibile if the FaceAlpha is set

  2. Eric Magee replied on :

    What I wanted to say above, but ran out of room, is that the transparency part does not work the same when the axes are logarithmic. The lines are visible but the gridlines are not.

  3. Francisco Bido replied on :

    Doug,

    I encourage you to provide some feedback to the graphics Developers. There are many of us Economists using Matlab and need a more refined version (more features and options) for this type of plot.

    Thanks!
    -Francisco

  4. sridharan kamalakannan replied on :

    I have a stack of 2D polygons. Can u suggest me a way to stack these polygons in 3D such that I get a 3D object out of these 2D polygons.

  5. Doug replied on :

    Sri,

    I am not sure I understand your question. Can you rephrase and elaborate?

    Thanks,
    Doug

  6. Sridharan Kamalakannan replied on :

    I have corodinates corresponding to 2-D polygons. There are ‘n’ such polygons which have ‘n’ different Z values. Basically they are polygons in different slices. I want to stack these polygons so that I can visually see a smooth 3-D object.

  7. Sridharan Kamalakannan replied on :

    Hi Doug,

    I have another question.

    I have a polygon which i coverted to a mask by using poly2mask command. Now i have to color the mask by using patch, i.e. i want to superimpose a color mask on an image such that I can adjust the transparency of the mask.

    In short I would like to know if there is some command to fill specific pixels with a color such that its transparency can be adjusted.

  8. Doug replied on :

    To your 2-d stacking problem above (6)

    http://www.mathworks.com/access/helpdesk/help/techdoc/ref/delaunay3.html

    Delaunay functions might be just what you are looking for.

    Transparency is controlled with Alpha:

    http://www.mathworks.com/access/helpdesk/help/techdoc/ref/alpha.html

    To set individual values based on your mask, you will want to review my video here:

    http://www.mathworks.com/matlabcentral/fileexchange/loadFile.do?objectId=16344&objectType=FILE

    Enjoy,
    Doug

    http://blogs.mathworks.com/pick

  9. KG replied on :

    In a 2d or 3d plot, how can you have set an axis in the logarithmic scale. i do not want to do it from the plot window, but wish to have this in the .m file itself while setting the axis.

  10. Doug replied on :

    KG:

    Try this:

    set(gca,’YScale’,'log’)

    Enjoy!
    Doug

  11. Olena replied on :

    Hello,
    How do you get rid of 10^5 in the lower right corner? Thank you,
    Olena

  12. Olena replied on :

    The bug and solutions are reported over here:
    http://www.mathworks.com/support/bugreports/details.html?rp=327079

    I found the last workaround to be the most useful one.

  13. Ahmed replied on :

    I have a surf and fill3 done on linear scale; but when I change the scale to lagarithmic using plot window, the plot loses its transparency. Is ther a way to keep the tranparency even after changing the scale to logarithmic from plot window.

  14. Doug replied on :

    Ahmed,

    Check the renderer
    >>get(gcf,’renderer’)

    Make sure it is openGL. That is the only renderer in MATLAB that supports transparency. I suspect it got changed and that is why you lost the effect.

    Doug

  15. James replied on :

    I have two question about this fucntion
    1. my first question is the same as the eleventh reviewer’s: how to get rid of the label, 10^5, on the lower right corner of the plot.
    2. the second one is how to copy the plot into a word or ppt file with losing any resolution. The copied plot either has very bad resolution or lose the transparency of pacthed area . I tried differrent ways, e.g. copy it directly from MATLAB, save or print it in eps, jgn,jpg,emf …. they just did not work.

  16. Ogi replied on :

    Hi All, I have following problem:

    For my 3D plot in Matlab I use
    set(gcf, ‘Renderer’, ‘OpenGL’) to maintain the transpparency of the surface independent of XScale type (see below):

    ************************************************
    figure;
    hold on;
    set(gcf, ‘Renderer’, ‘OpenGL’);
    set(gca, ‘XScale’, ‘log’);
    view(3);
    surf(X1,Y1,Z1,’FaceColor’,'red’,'EdgeColor’,'none’,…
    ‘FaceAlpha’,0.4,’FaceLighting’,'phong’);

    % X1,Y1,Z1 data is positive

    ***********************************************************

    The problem is that my XScale looks like ‘log’ but the surface looks like the XScale where ‘lin’. In other words, if I change the XScale from ‘log’ to ‘lin’, the surface does not change, it does not react to XScale. However, this is only valid for XScale.

    If I do not change Renderer to ‘OpenGL’ than everything works fine but than the plot loses its transparency by changing any ‘lin’ scale to ‘log’.

  17. Ogi replied on :

    If found the answer:

    OpenGL does not support logarithmic-scale axes! :-(((((

    What now?

  18. Patrick replied on :

    On matlab 6.5.1 one could draw an area plot and set the FaceAlpha to give a transparency. With this one could plot a filled contour graph and over-plot with an area graph which grey-ed out non-significant areas whilst leaving the significant areas un-touched. The bright sparks have now taken away the FaceAlpha property of area plots (areaseries), presumably wanting us to go in with primitives (like patch) and render each polygon in the area under a complex curve to be transparent (what a great improvement!). Any ideas how to do this with a minimum of fuss?

  19. Doug replied on :

    @Patrick,

    I am not sure I understand the question, but I think you might be interested in CONTOURF and AREA (see the final example in the doc specifically)

    Thanks,
    Doug

  20. zapissa replied on :

    concerning the transparency with logarithmic plots issue (see comment on opengl renderer above): I wanted to shade overlapping confidence intervals with transparency in a plot with logarithmic axes. one option to at least make it look like it was transparent is to find the intersection between the two patches with polybool and then color it with an intermediate color between the two patch colors..

Leave a Reply

Wrap code fragments inside <pre> tags, like this:

<pre class="code">
a = magic(3);
sum(a)
</pre>

If you have a "<" character in your code, either follow it with a space or replace it with "&lt;" (including the semicolon).


MathWorks

Brett & Jiro share their favorite user-contributed submissions from the File Exchange.

These postings are the author's and don't necessarily represent the opinions of The MathWorks.