File Exchange Pick of the Week

February 15th, 2008

GUI Layout (Part 1)

This is a post from Jiro, one of our guest bloggers:

One of my favorite things to do in MATLAB is to build GUIs. This is Part 1 of 3 Pick of the Week entries on GUIs.

When I build GUIs, I think about not only the functionalities, but also the aesthetics of them. I like buttons and sliders to be a certain size, and I want them to resize appropriately when I change the size of the figure window.

In MATLAB GUIs, the handle graphics objects have a Units property which specifies the units to use for positioning the objects. Using the Normalized option allows the objects to resize proportionally with the figure. In order to keep some components from becoming oversized or undersized, I often define a ResizeFcn for the figure to adjust the positions of the objects. For example, take a look at the following example:

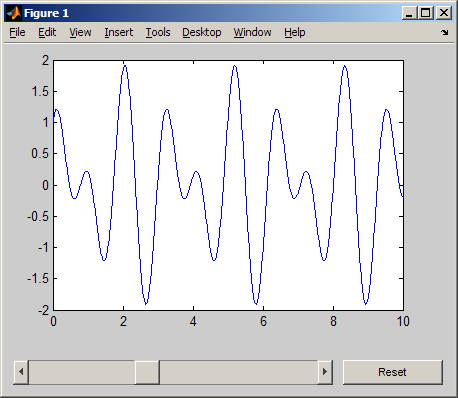
First, here's the GUI at a particular size:

Next, here's the same GUI after resizing it to a smaller size:

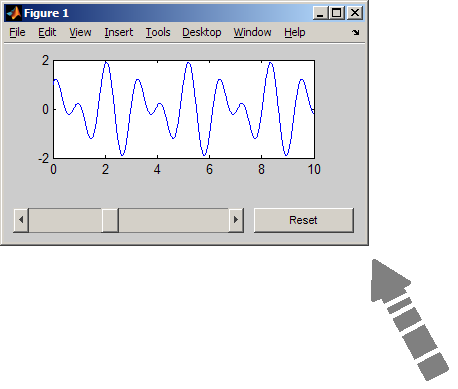
Notice how the size of the push button remained the same and the slider bar and the axes adjusted their size appropriately to fill the remaining space. See an Animated GIF of it.

You can see how I did it here: Dynamic GUI Layout.

The key part of the function is this:

 function myResizeFcn(varargin)
   % Figure resize callback
   %   Adjust object positions so that they maintain appropriate
   %   proportions
   fP = get(figH, 'Position');
   set(sliderH, 'Position', [10       , 10, fP(3)-130, 25       ]);
   set(buttonH, 'Position', [fP(3)-110, 10, 100      , 25       ]);
   set(axesH  , 'Position', [50       , 85, fP(3)-100, fP(4)-130]);
 end

Every time the figure is resized, it determines the current figure size and then positions the objects accordingly.

This has worked nicely for me, but I always find things out in the File Exchange bucket that would make my life easier. Stay tuned for Part 2 and Part 3, in which I will introduce a couple of entries that I found useful for GUI layouts.

Comments?

Tell us about some of the things you do to make your GUI nicer (both functionally and aesthetically).

Written by Jiro Doke, Senior Applications Engineer, The MathWorks, Inc.


Get the MATLAB code

Published with MATLAB® 7.5

6 Responses to “GUI Layout (Part 1)”

  1. Ken replied on :

    Great tips Jiro! I too like aesthetically pleasing user interfaces, part of which is correct resizing capabilities. Brian Cody also touched on this topic over at The MATLAB Desktop Blog in an entry titled Managing Layout in the Absence of Layout Management.

    -Ken

  2. Jiro replied on :

    Thanks, Ken.

    You are ahead of the game. Stayed tuned for Part 3… :)

  3. Tom replied on :

    Matlab is a new field for me now, I want to learn it more.Thanks for your work,Jiro.I like it.
    -Tom

  4. Julio replied on :

    Great work Jiro. I’d just like to add that I used to make guis in my laptop (1024×768) and maximized using maximize.m from the File Exchange. When I changed computers to my main PC, the screen resolution is 1280×960 and the picture totally messed up. Using your resize methods I could move everyting good, but I also recommend using:

    get(0, ‘ScreenSize’);

    to get the resolution of the monitor. This is useful to move and position certain things that should be done in pixels rather than normalized units. I hope this helps a little.

  5. Matthew Adler replied on :

    In this spectrum file that you are showing in the figure - I assume that the slider allows the user to change the range in x and then the y-values adjust automatically as the slider is used? What code do you use to do this? I know how to link a slider to a variable, but not to the range (scale). Maybe you just have the axis on ‘auto’ and matlab is smart enough to rescale automatically?

  6. jiro replied on :

    Matthew,

    The slider actually changes the equation being plotted on the figure. Take a look at the link above “Dynamic GUI Layout” which is the File Exchange file that you can download.

    The default behavior of axes is that they automatically scale based on the data that is plotted. You can manually change the scale by using the XLIM, YLIM, ZLIM commands, or changing the respective properties of the axes. Take a look at this page for the axes properties you can change:

    http://www.mathworks.com/access/helpdesk/help/techdoc/ref/axes_props.html

Leave a Reply

Wrap code fragments inside <pre> tags, like this:

<pre class="code">
a = magic(3);
sum(a)
</pre>

If you have a "<" character in your code, either follow it with a space or replace it with "&lt;" (including the semicolon).


Bob, Brett & Jiro share their favorite user-contributed submissions from the File Exchange.

  • Zach: Hi Doug and Les, I didn’t have a lot of time to mess with this, but I did find a work-around. I plotted...
  • hamed: k
  • Les: @Zach This isn’t exactly what you are looking for but at least it puts all three parameters on the same...
  • Zach: Thanks for your suggestions Doug. I’ll give that a shot and see what happens. I’ve seen many of...
  • Doug: @Zach, I would say to use plotYYY, because that is close to what you want, but using depth as Y makes sense....
  • Doug: @Teja, I think this will work: http://www.mathworks .com/access/helpdesk /help/techdoc/ref...
  • Gify: merry christmas :) nice christmas tree! Regards, Janet Gify
  • Teja: Dear Doug Is there anyway to plot a surface from nonuniform data without meshgrid and griddata? Basically i...
  • Zach: I’m working with geophysical data, so I’d like to produce a depth profile. The y-axis would be...
  • Doug: @Ashok First, please do not use variable names that are MATLAB commands (std and mean). Second, p(j) should be...

These postings are the author's and don't necessarily represent the opinions of The MathWorks.