
Finding Local Extrema
Many times, I've wanted a quick way to find the local minima or maxima in my data. Carlos Adrian Vargas Aguilera's submission EXTREMA makes it easy to do, and is Brett's selection for the Pick of the Week.
 Now consider how easy it is to find the extrema with Carlos's EXTREMA function:

 (Note that there are lots of options for SMOOTH. I've just implemented a [default] moving average filter, using a 20-point
sliding neighborhood.)
Carlos also bundled EXTREMA with a second function called EXTREMA2 that extends the functionality to three-dimensional data,
and he provided a nice graphic that shows off the utility of his code. I see that his functions also inspired another submission,
called MinimaMaxima3D. Very nice work, Carlos!
(Note that there are lots of options for SMOOTH. I've just implemented a [default] moving average filter, using a 20-point
sliding neighborhood.)
Carlos also bundled EXTREMA with a second function called EXTREMA2 that extends the functionality to three-dimensional data,
and he provided a nice graphic that shows off the utility of his code. I see that his functions also inspired another submission,
called MinimaMaxima3D. Very nice work, Carlos!
Contents
The Problem:
This morning, I was asked to help a customer find local peaks (minima and maxima) in a trace from some sort of medical device. The particulars of the signal are not really relevant here; what is important is that the signal was large and jagged, with many local extrema. This clearly was not something the customer--or I!--wanted to do manually. Moreover, of course, there might be more traces on which we would want to repeat the analysis, so any algorithm we developed should be able to be incorporated in an automation routine. My first thought was to search MATLAB's documentation for extrema detection. I found that the Signal Processing Blockset has a Peak Detection Block that finds local minima and maxima, but that solution, of course, requires Simulink. Being the MATLAB geek that I am, I wanted to do this entirely in m-code. Next, though implementing my own algorithm wouldn't be too difficult, I thought to search for someone else's implementation of an extrema detector. (No sense reinventing the wheel!)Finding local maxima and minima
A quick search turned up Carlos's highly rated, much-downloaded EXTREMA. I happily grabbed his code and took it for a test spin. Result: problem solved! Consider the following artificial noisy data:t= 0:pi/16:8*pi; y = sin(t).*rand(size(t)); plot(t,y)
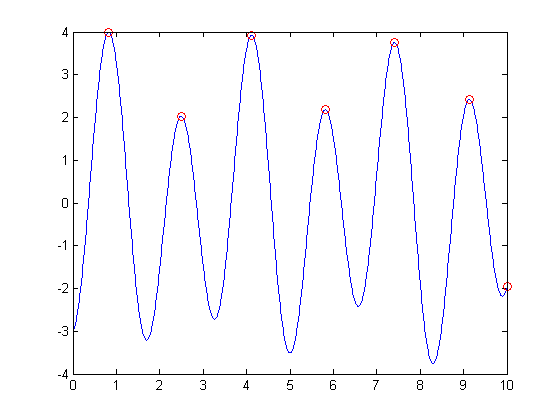
Now consider how easy it is to find the extrema with Carlos's EXTREMA function:
figure
plot(t,y)
[ymax,imax,ymin,imin] = extrema(y);
hold on
plot(t(imax),ymax,'r*',t(imin),ymin,'g*')
What about smoothing those data?
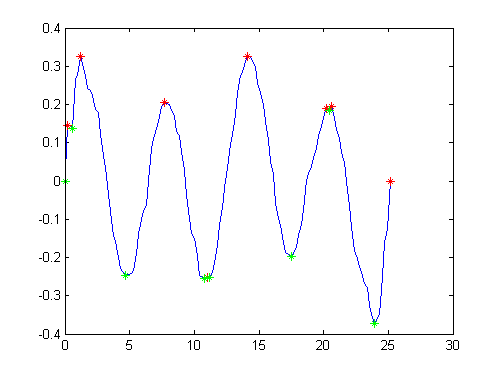
By the way, given a noisy source, it might also be nice to have a way to smooth the data. A quick search for SMOOTH in MATLAB's help browser shows how to do that with the always-useful Curve Fitting Toolbox:y2 = smooth(y,20); figure plot(t,y2) [ymax2,imax2,ymin2,imin2] = extrema(y2); hold on plot(t(imax2),ymax2,'r*',t(imin2),ymin2,'g*') hold off
(Note that there are lots of options for SMOOTH. I've just implemented a [default] moving average filter, using a 20-point
sliding neighborhood.)
Carlos also bundled EXTREMA with a second function called EXTREMA2 that extends the functionality to three-dimensional data,
and he provided a nice graphic that shows off the utility of his code. I see that his functions also inspired another submission,
called MinimaMaxima3D. Very nice work, Carlos!
- Category:
- Picks


Comments
To leave a comment, please click here to sign in to your MathWorks Account or create a new one.