
Smooth MATLAB Graphics
Jiro's pick this week is MYAA by Anders Brun.
A few months ago, I wrote a post for Loren's Art of MATLAB blog about creating publication-quality graphics. That post was about controlling various properties of graphics objects to make the visualization a higher quality.
Another way of making better-looking graphics is to use anti-aliasing. Anti-aliasing provides a smoother look to the lines
drawn on the screen. PCs use anti-aliasing to make the fonts smoother. With MYAA, you can easily anti-alias your MATLAB graphics. This is great for both on-screen presentation as well as MATLAB publishing (this blog post is a published document).
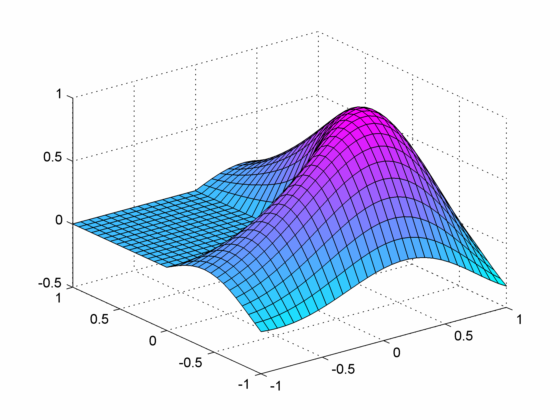
Original Plot
With the regular screen resolution, you can see the aliasing. It is most apparent with diagonal lines.
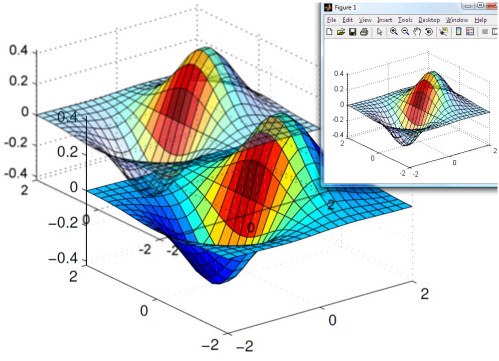
 Anti-Aliased Plot
Anti-aliased plot looks much smoother. MYAA supersamples the plot (as an image) and then resizes it (via a filtering method), giving an anti-aliased look.
Anti-Aliased Plot
Anti-aliased plot looks much smoother. MYAA supersamples the plot (as an image) and then resizes it (via a filtering method), giving an anti-aliased look.
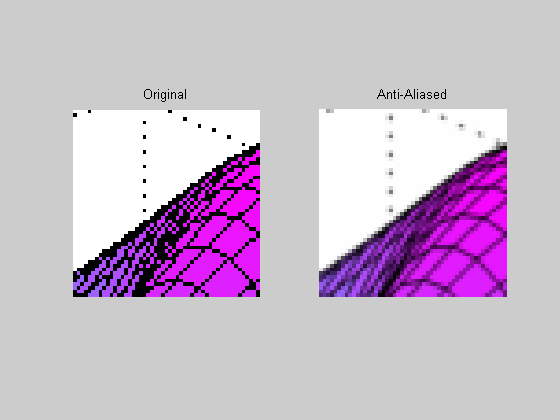
 If we take a closer look at the two images, you can see the anti-aliasing effect.
 More Features
MYAA has additional features that make it a very handy tool. For example, you can specify the supersampling factor to provide
an even smoother look. The tool also has a nice interactive feature where you can refresh the graphics (after zooming or rotating
the original plot) or zoom in and out with the anti-aliased plot.
Finally, I like how Anders has been quickly updating his entry in response to the user feedback. He posted this file early
this month, and he has already updated several times, making this tool more user-friendly.
Comments
Do you ever make presentations directly from MATLAB? What are some tricks you employ to make MATLAB a presentation tool? As
a starter, I once created a MATLAB animation player for displaying animations. Tell us about your stories here.
More Features
MYAA has additional features that make it a very handy tool. For example, you can specify the supersampling factor to provide
an even smoother look. The tool also has a nice interactive feature where you can refresh the graphics (after zooming or rotating
the original plot) or zoom in and out with the anti-aliased plot.
Finally, I like how Anders has been quickly updating his entry in response to the user feedback. He posted this file early
this month, and he has already updated several times, making this tool more user-friendly.
Comments
Do you ever make presentations directly from MATLAB? What are some tricks you employ to make MATLAB a presentation tool? As
a starter, I once created a MATLAB animation player for displaying animations. Tell us about your stories here.
membrane
Anti-Aliased Plot
Anti-aliased plot looks much smoother. MYAA supersamples the plot (as an image) and then resizes it (via a filtering method), giving an anti-aliased look.
myaa
If we take a closer look at the two images, you can see the anti-aliasing effect.
im1 = imread('antialias_01.png');
im2 = imread('antialias_02.png');
subplot(1,2,1);
imshow(im1(100:150, 300:350, :));
title('Original');
subplot(1,2,2);
imshow(im2(100:150, 300:350, :));
title('Anti-Aliased');
More Features
MYAA has additional features that make it a very handy tool. For example, you can specify the supersampling factor to provide
an even smoother look. The tool also has a nice interactive feature where you can refresh the graphics (after zooming or rotating
the original plot) or zoom in and out with the anti-aliased plot.
Finally, I like how Anders has been quickly updating his entry in response to the user feedback. He posted this file early
this month, and he has already updated several times, making this tool more user-friendly.
Comments
Do you ever make presentations directly from MATLAB? What are some tricks you employ to make MATLAB a presentation tool? As
a starter, I once created a MATLAB animation player for displaying animations. Tell us about your stories here.
- Category:
- Picks


Comments
To leave a comment, please click here to sign in to your MathWorks Account or create a new one.