
GUI Layout (Part 5)
Jiro's pick this week is EasyGUI by a fellow MathWorker, Gautam.
function potw_easygui()This is a continuation of our GUI series:
The last week's pick (Part 4) significantly simplified the programmatic layout process by providing simple control for the placement and size of the graphical components. EasyGUI takes it to the next level so that you don't need to worry about the layout at all. Sometimes, you just want a functional GUI with the graphical controls in the "right" place.
EasyGUI is implemented using the MATLAB Class System. GUIs lend itself to object-oriented programming, because you can think of graphical components as objects.
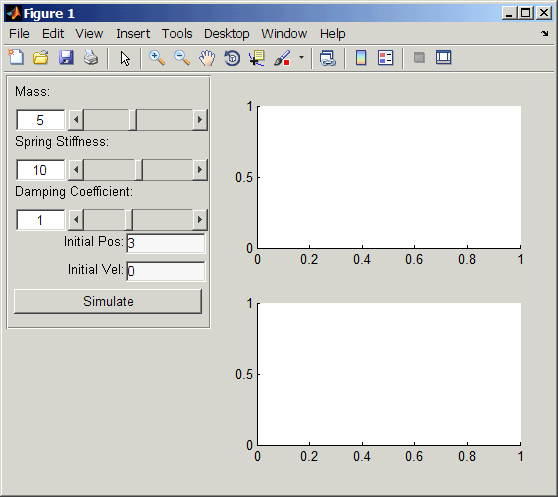
Let's take a look at an example. I want to create a pedagogical GUI that shows how a damped mass-spring system behaves. Here are the controls that I want:
- Slider to manipulate the mass
- Slider to manipulate the spring stiffness
- Slider to manipulate the damping coefficient
- Edit box to change the initial position
- Edit box to change the initial velocity
- Push button to "Simulate"
This is how I would create it using EasyGUI:
% Main GUI window (with auto layout)
mygui = gui.autogui;
mygui.Position.width = 550;     % Set the width of GUI

% Mass with min of 1 and max of 10
param.mass = gui.slider('Mass:', [1 10], mygui);
param.mass.Value = 5;           % Set initial value

% Spring stiffness with min of 0 and max of 20
param.spring = gui.slider('Spring Stiffness:', [0 20], mygui);
param.spring.Value = 10;        % Set initial value

% Damping with min of -5 and max of 10
param.damping = gui.slider('Damping Coefficient:', [-5 10], mygui);
param.damping.Value = 1;        % Set initial value

% Initial Position
param.iX = gui.editnumber('Initial Pos:', mygui);
param.iX.Value = 3;             % Set initial value
param.iX.LabelLocation = 'left';
param.iX.LabelAlignment = 'right';

% Initial Velocity
param.iV = gui.editnumber('Initial Vel:', mygui);
param.iV.Value = 0;             % Set initial value
param.iV.LabelLocation = 'left';
param.iV.LabelAlignment = 'right';

% Simulate Button
param.simulate = gui.pushbutton('Simulate', mygui);

% Create Subplots
param.ax(1) = subplot(2,1,1);
param.ax(2) = subplot(2,1,2);
Notice that each block of commands corresponds to a GUI component, and the properties that I defined were straight-forward. But more importantly, I didn't need to worry about the layout. The commands automatically placed the components in the order that they were created.
Now, we can assign a function to be evaluated for the push button. I pass in param (which is a structure containing the GUI component object) as an additional input to the function.
% Assign Callback
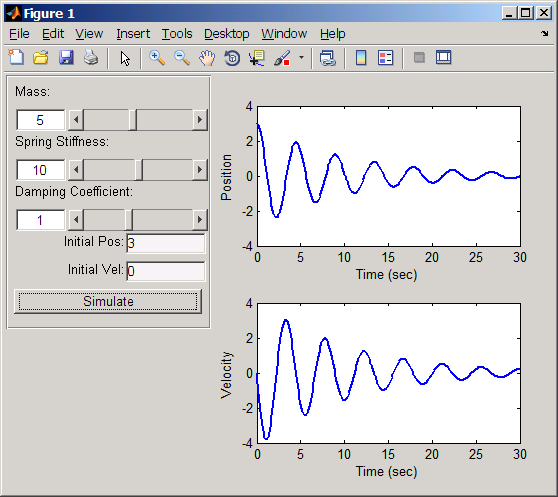
param.simulate.ValueChangedFcn = @(obj) runSimulation(obj, param);runSimulation.m simply integrates the ODE using the parameters specified in the GUI and plots the results
function runSimulation(obj, param)% Integrate for 30 seconds using ODE45 [t, y] = ode45(@(t, x) msdSystem(t, x, param), ... 0:.1:30, [param.iX.Value, param.iV.Value]); % Plot position and velocity axes(param.ax(1)); plot(t, y(:,1), 'LineWidth', 2); xlabel('Time (sec)'); ylabel('Position'); axes(param.ax(2)); plot(t, y(:,2), 'LineWidth', 2); xlabel('Time (sec)'); ylabel('Velocity');
msdSystem.m is the 2nd-order ODE for the damped mass-spring system:
function dy = msdSystem(t, y, param)% Parameters m = param.mass.Value; k = param.spring.Value; b = param.damping.Value; % System of linear equations for a damped mass-spring system dy(1,1) = y(2); dy(2,1) = 1/m * (-k*y(1) - b*y(2));
If I click on "Simulate", then I get this:
Try it out
There's so much more to this great tool. What I showed was an auto-layout option, where you let the tool determine the placement of components, but it also allows you to manually control the placement. It has a very detailed PDF documentation as well as a number of example files.
Give it a try and you'll be building sophisticated GUIs in no time.
- Category:
- GUI or GUIDE,
- Picks


Comments
To leave a comment, please click here to sign in to your MathWorks Account or create a new one.