File Exchange Pick of the Week

October 30th, 2009

allstats

Bob's pick this week is Allstats by Francisco de Castro.

The file is simple enough. Given a data set,

x = randn(1000,1);
hist(x,100)

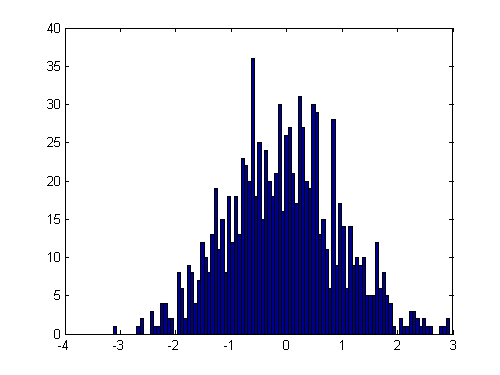
allstats returns a list of statistical values.

myStats = allstats(x)
myStats = 
      min: -3.1289
      max: 2.9371
     mean: -0.06815
      std: 1.0019
     mode: -3.1289
     q2p5: -1.9519
       q5: -1.7128
      q25: -0.73464
      q50: -0.072006
      q75: 0.55077
      q95: 1.6351
    q97p5: 1.8844

The mean should be close to zero,

myStats.mean
ans =
     -0.06815

and the standard deviation should be close to one.

myStats.std
ans =
       1.0019

How convenient.

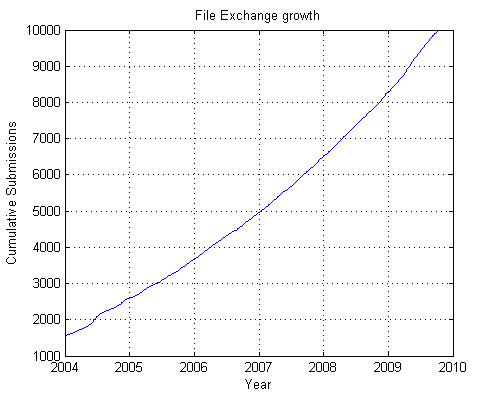
As it turns out, this month the File Exchange recently celebrated a major milestone. Allstats has the honor of being the official 10,000-th submission. Congratulations to Francisco and every contributor who made this possible! Growth of the File Exchange has been absolutely amazing.

If only my retirement account was that impressive! (sigh)

Comments?


Get the MATLAB code

Published with MATLAB® 7.9

3 Responses to “allstats”

  1. oleg replied on :

    Allstats has no checks, no comments and could also be improved (talking about prctile implementatio). Not to mention that a function which deserves an “all” prefix should at least include skewness and kurtosis.

  2. oleg replied on :

    The author has implemented skewness, kurtosis and checks answering appropriately to the critic.

  3. Jon replied on :

    This is a useful tool - but in fairness I have to point out that it is remarkably similar to a routine of the same name published by D. C. Hanselman in Mastering Matlab 7 published in 2005. Hanselman’s routine has the added virtue of implementing all of the statistical measures internally and thus does not require the Statistics Toolbox.

Leave a Reply

Wrap code fragments inside <pre> tags, like this:

<pre class="code">
a = magic(3);
sum(a)
</pre>

If you have a "<" character in your code, either follow it with a space or replace it with "&lt;" (including the semicolon).


Bob, Brett & Jiro share their favorite user-contributed submissions from the File Exchange.

  • Zach: Hi Doug and Les, I didn’t have a lot of time to mess with this, but I did find a work-around. I plotted...
  • hamed: k
  • Les: @Zach This isn’t exactly what you are looking for but at least it puts all three parameters on the same...
  • Zach: Thanks for your suggestions Doug. I’ll give that a shot and see what happens. I’ve seen many of...
  • Doug: @Zach, I would say to use plotYYY, because that is close to what you want, but using depth as Y makes sense....
  • Doug: @Teja, I think this will work: http://www.mathworks .com/access/helpdesk /help/techdoc/ref...
  • Gify: merry christmas :) nice christmas tree! Regards, Janet Gify
  • Teja: Dear Doug Is there anyway to plot a surface from nonuniform data without meshgrid and griddata? Basically i...
  • Zach: I’m working with geophysical data, so I’d like to produce a depth profile. The y-axis would be...
  • Doug: @Ashok First, please do not use variable names that are MATLAB commands (std and mean). Second, p(j) should be...

These postings are the author's and don't necessarily represent the opinions of The MathWorks.