
Labeling an Array of Subplots
Brett's Pick this week is "MTIT: A Pedestrian Major Title Creator", by Us.
If you have the Bioinformatics Toolbox, you may be familiar with the suptitle function, which was originally created as a helper function for an in-Toolbox demo. Additionally, and especially if you've been following this blog for a long time, you may be familiar with Ben Barrowes's Toolbox-independent suplabel, which my predecessor Scott Hirsch selected as a Pick-of-the-Week in June of 2005.
This week, I wanted to feature another entry in the "label-your-subplots" category. Us's mtit is, as we've come to expect, solidly implemented, and the syntax is simple, and, in the output variable, provides easy access to changing the properties of the text-containing axes and the label (text) itself.
img = imread('peppers.png');
exploreRGB(img,2)
h = mtit('Here is my Supertitle');
set(h.th,'fontsize',18,'color','b')
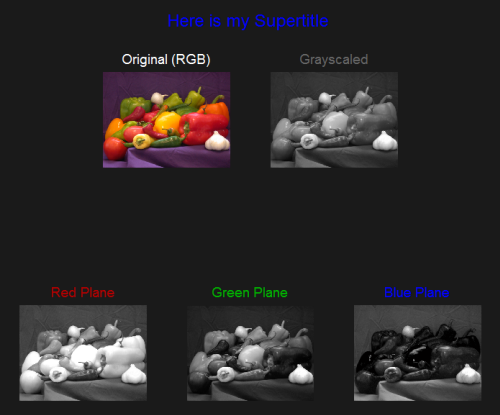
(Pardon the plug for my own exploreRGB; I find it quite useful when I'm analyzing color images. Consider it lagniappe, and grab it if you'd like!)
- Category:
- Picks


See Also
-
labelEdgeSubPlots
Blogs
-

Labeling Data Points
Blogs


Comments
To leave a comment, please click here to sign in to your MathWorks Account or create a new one.