
Touch-Tone Telephone Dialing
We all use Fourier analysis every day without even knowing it. Cell phones, disc drives, DVDs, and JPEGs all involve fast finite Fourier transforms. This post, which describes touch-tone telephone dialing, is the first of three posts about the computation and interpretation of FFTs. The posts are adapted from chapter 8 of my book, Numerical Computing with MATLAB .

 For example, this is the display produced by touchtone for the "1" button. The top subplot depicts the two underlying frequencies and the bottom subplot shows a portion of the signal obtained by averaging the sine waves with those frequencies.
 This recording is noisy. You can even see small spikes on the graph at the times the buttons were clicked. It is easy to see that 11 digits were dialed, but, on this scale, it is impossible to determine the specific digits.
Here is the magnitude of the FFT of the signal, which is the key to determining the individual digits.
This recording is noisy. You can even see small spikes on the graph at the times the buttons were clicked. It is easy to see that 11 digits were dialed, but, on this scale, it is impossible to determine the specific digits.
Here is the magnitude of the FFT of the signal, which is the key to determining the individual digits.

 For this segment, there are only two peaks, indicating that only two of the basic frequencies are present in this portion of the signal. These two frequencies come from the "1" button. You can also see that the waveform of a short portion of the first segment is similar to the waveform that our synthesizer produces for the "1" button. So we can conclude that the number being dialed in touchtone starts with a 1. We leave it as an exercise to continue the analysis with touchtone and identify the complete phone number.
Contents
DTMF
Touch-tone telephone dialing is an example of everyday use of Fourier analysis. The basis for touch-tone dialing is the Dual Tone Multi-Frequency (DTMF) system. Synthesis is the generation of analog tones to represent digits in phone numbers. Analysis is the decoding of these tones to retrieve the digits. The program touchtone, which is available here, or which is included with my NCM App, demonstrates both these aspects of DTMF.
Synthesis
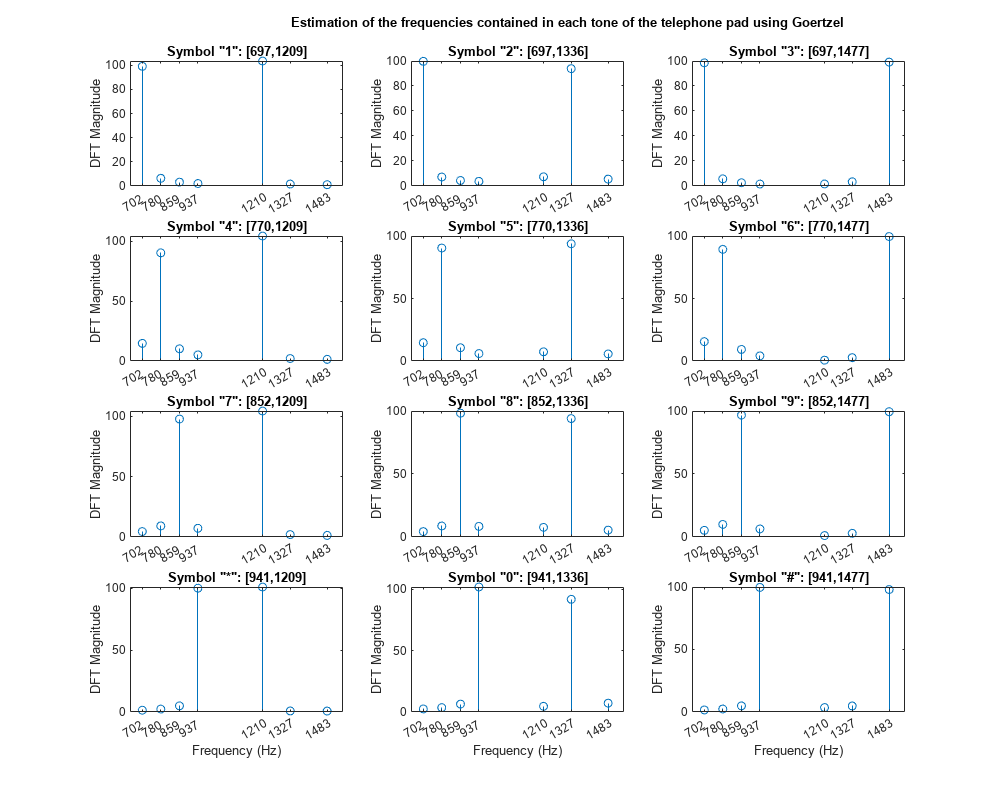
The telephone dialing pad acts as a 4-by-3 matrix. Associated with each row and column is a frequency. These basic frequencies arefr = [697 770 852 941]; fc = [1209 1336 1477];These frequencies were chosen so that none is an integer multiple of any other. In fact the ratios are 21/19. This avoids interfering overtones. If s is a character that labels one of the buttons on the keypad, the corresponding row index k and column index j can be found with
switch s
   case '*', k = 4; j = 1;
   case '0', k = 4; j = 2;
   case '#', k = 4; j = 3;
   otherwise,
      d = s-'0'; j = mod(d-1,3)+1; k = (d-j)/3+1;
end
An important parameter in digital sound is the sampling rate.
Fs = 32768A vector of points in one-fourth of a second at this sampling rate is
t = 0:1/Fs:0.25The tone generated by the button in position (k,j) is obtained by superimposing the two fundamental tones with frequencies fr(k) and fc(j).
y1 = sin(2*pi*fr(k)*t);
y2 = sin(2*pi*fc(j)*t);
y = (y1 + y2)/2;
If your computer is equipped with a sound card, the statement
sound(y,Fs)plays the tone.
The "1" button
For example, this is the display produced by touchtone for the "1" button. The top subplot depicts the two underlying frequencies and the bottom subplot shows a portion of the signal obtained by averaging the sine waves with those frequencies.
Analysis
How is it possible to determine a phone number by listening to the signal generated? This involves the FFT, the Finite Fourier Transform, or, more likely, some specialized version of the FFT adapted to this task. I will discuss the FFT in my next post. The data file touchtone.mat contains a recording of a telephone being dialed. The file is available fromhttps://www.mathworks.com/moler.htmlncm/touchtone.matGo to the Home tab above the MATLAB command window, click on the Open tab and insert this URL into the File name slot. This will load a structure y into your MATLAB workspace. Then the statement
ywill produce
  y =
   sig: [1x74800 int8]
    fs: 8192
This shows that y has two fields, an integer vector y.sig, of length 74800, containing the signal, and a scalar y.fs, with the value 8192, which is the sample rate.
max(abs(y.sig))reveals that the elements of the signal are bounded in absolute value by 127. So the statements
  Fs = y.fs;
  y = double(y.sig)/128;
save the sample rate, rescale the vector and convert it to double precision. The statements
  n = length(y);
  t = (0:n-1)/Fs
reproduce the sample times of the recording. The last component of t is 9.1307, indicating that the recording lasts a little over 9 seconds. The next figure is a plot of the entire signal.
This recording is noisy. You can even see small spikes on the graph at the times the buttons were clicked. It is easy to see that 11 digits were dialed, but, on this scale, it is impossible to determine the specific digits.
Here is the magnitude of the FFT of the signal, which is the key to determining the individual digits.
p = abs(fft(y));
f = (0:n-1)*(Fs/n);
plot(f,p);
axis([500 1700 0 600])
The x -axis corresponds to frequency. The axis settings limit the display to the range of the DTMF frequencies. There are seven peaks, corresponding to the seven basic frequencies. This overall FFT shows that all seven frequencies are present someplace in the signal, but it does not help determine the individual digits. The touchtone program also lets you break the signal into 11 equal segments and analyze each segment separately. The next figure is the display from the first segment.
For this segment, there are only two peaks, indicating that only two of the basic frequencies are present in this portion of the signal. These two frequencies come from the "1" button. You can also see that the waveform of a short portion of the first segment is similar to the waveform that our synthesizer produces for the "1" button. So we can conclude that the number being dialed in touchtone starts with a 1. We leave it as an exercise to continue the analysis with touchtone and identify the complete phone number.
Extra
touchtone has a hidden "Easter egg" that, as far as I know, has never been uncovered. If anyone finds it, submit a comment and let us know.Reference
Cleve Moler, Numerical Computing with MATLAB, Electronic Edition, MathWorks, <https://www.mathworks.com/moler/index_ncm.html>, Print Edition, SIAM Revised Reprint, SIAM, 2008, 334 pp., <http://bookstore.siam.org/ot87> .- Category:
- Algorithms,
- Fun,
- History,
- Numerical Analysis


Comments
To leave a comment, please click here to sign in to your MathWorks Account or create a new one.