
A Sixty-Year Old Program for Predicting the Future
The graphics in my post about R^2 were produced by an updated version of a sixty-year old program involving the U.S. census. Originally, the program was based on census data from 1900 to 1960 and sought to predict the population in 1970. The software back then was written in Fortran, the predominate technical programming language a half century ago. I have updated the MATLAB version of the program so that it now uses census data from 1900 to 2020.
Contents
censusapp2024
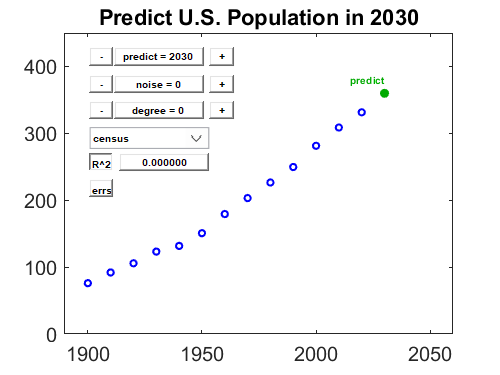
The latest version of the census application is now available at censusapp2024. Here are the data and the opening screenshot.
[t,p]=UScensus;fprintf('%12d%12.3f\n',[t,p]')
        1900      75.995
        1910      91.972
        1920     105.711
        1930     123.203
        1940     131.669
        1950     150.697
        1960     179.323
        1970     203.212
        1980     226.505
        1990     249.633
        2000     281.422
        2010     308.746
        2020     331.449
Risky Business
Today, MATLAB makes it easier to vary parameters and visualize results, but the underlying mathematical principles are unchanged:
- Using polynomials to predict the future by extrapolating data is a risky business.
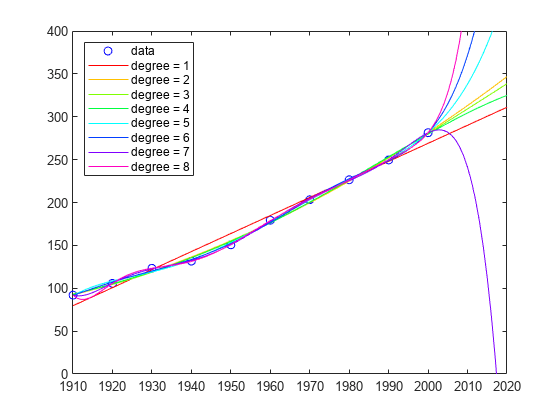
One new observation is added to the data every 10 years, when the United States does the decennial census. Originally there were only 7 observations; today there are 13. The program now allows you to fit the data exactly by interpolation with a polynomial of degree 12 or fit it approximately by polynomials of degree less than 12.
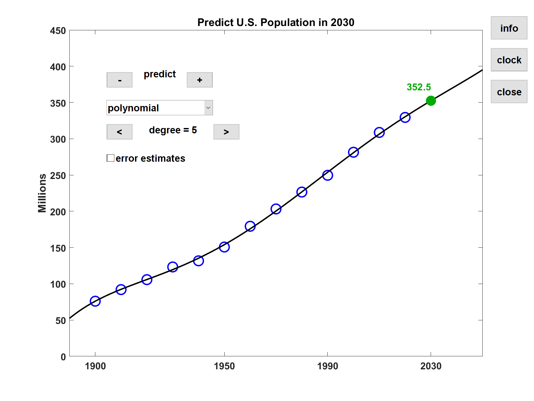
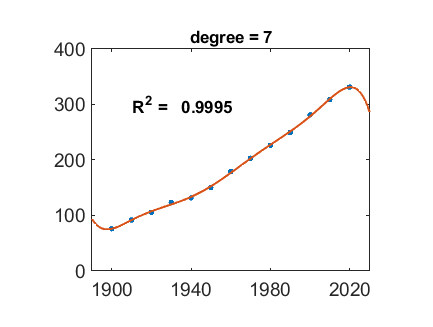
Here are the least-squares fits with linear, cubic, and degree seven polynomials and the interpolating polynomial. As the polynomial degree increases, so does R^2, until R^2 reaches one with the exact fit.
Do any of these fits look like they could be used to predict future population growth?

Splines
In addition to polynomials, you can choose interpolation by three different piecewise Hermite cubics.
- spline Continuous second derivate, "not-a-knot" end condition.
- pchip Continuous first derivative, strictly shape-preserving.
- makima Continuous first derivative, relaxed shape-preserving.
Since these fits interpolate the data, all their R^2 values are one. But before 1900 and after 2020 these functions are cubic polynomials that are not designed for extrapolation.

Exponentials
It is also possible to do nonlinear least squares fits by an exponential, a logistic sigmoid, and an exponential of an exponetial known as the Gompertz model.
- exponential exp(b*t+c)
- logistic a./(1+exp(-b*(t-c)))
- gompertz a*exp(-b*exp(-c*t))
An article by Kathleen and Even Tjørve, from the Inland Norway University of Applied Sciences in Elverum, Norway, in the journal PLOS ONE has this to say about Gompertz. "The Gompertz model has been in use as a growth model even longer than its better known relative, the logistic model. The model, referred to at the time as the Gompertz theoretical law of mortality, was first suggested and first applied by Mr. Benjamin Gompertz in 1825. He fitted it to the relationship between increasing death rate and age, what he referred to as 'the average exhaustions of a man’s power to avoid death” or the 'portion of his remaining power to oppose destruction.' "

Predictions
Which fits are suitable for predicting future population size?
Despite their large R^2 values, polynomials of any degree are not suitable because outside of the time interval they behave like polynomials and do not provide realistic predictions.
Splines were never intended for extrapolation.
That leaves the exponentials. The simple exponential model grows exponentially and is not suitable. The Gompertz fit does approach a finite asymptotic limit, but the value is an astronimical a = 2101, corresponding to 2.1 $\times 10^9$ inhabitants. Hopefully, that is out of the question.
The logistic fit has an asymptotic limit of a = 655.7. We recently passed the value of t where p(t) reaches a/2, namely c = 2018. So, the logistic model predicts that the long-term size of the U.S. population will be about twice its current value. Is that realistic? Probably not.

Conclusion
The British statistician George Box once said, "all models are wrong, some are useful." This is true of the models of the U. S. Census that I have discussed over the past sixty years.
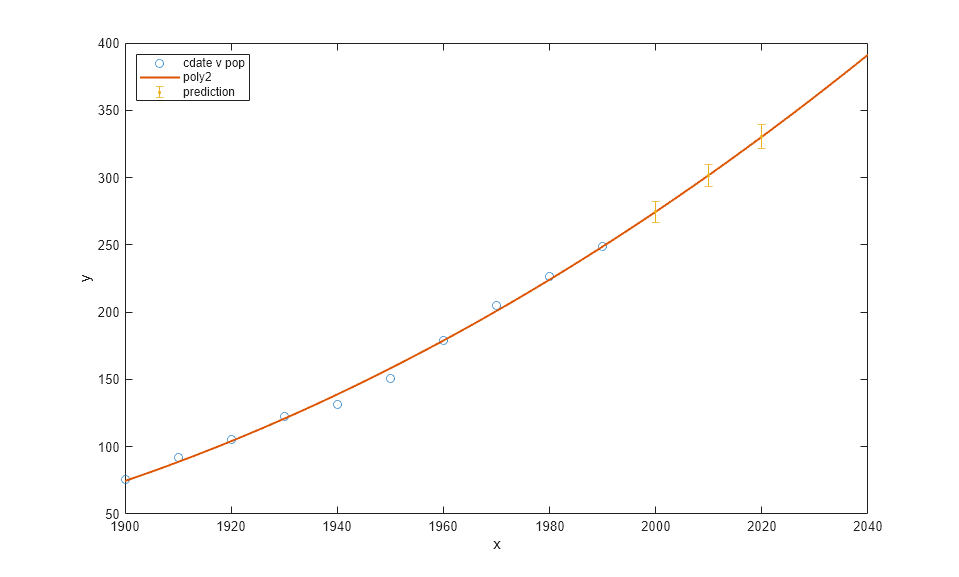
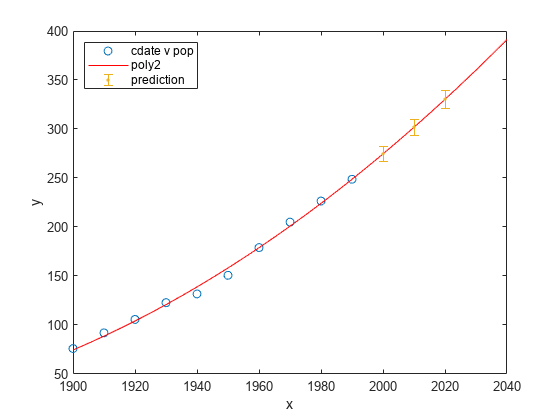
Here is censusapp2024 after all its buttons have been pushed. The extrapolation date is set to 2040. White noise has been added to the data. The model is a fourth-degree polynomial with an R^2 = 0.99. The R^2 value and the error estimates produced by errs account for errors in the data, but not in the model.
This particular model does a lousy job of predicting even twenty years in the future. Some of the other models are better, many are worse. Hopefully, their study is worthwhile.

Blogs
I have made blog posts about the census before, in 2020 and in 2017.
FMM
Predicting population growth is featured in Computer Methods for Mathematical Computations, by George Forsythe, Mike Malcolm and myself, published by Prentice-Hall in 1977. That textbook is now available from an interesting smorgasbord of sources, including Google Scholar, Amazon, dizhasneatstuff, Abe Books, Internet Archive, PDAS, WorldCat (Chinese).
Software
censusapp2024 is available at censusapp2024.
- Category:
- Fun,
- Graphics,
- History,
- Numerical Analysis,
- Statistics


Comments
To leave a comment, please click here to sign in to your MathWorks Account or create a new one.