
ThingSpeak Now Supports MATLAB Swarm Scatter Charts
ThingSpeak automatically gives you access to the latest MATLAB features from the latest MATLAB release. MATLAB R2020b now includes swarmchart to create sarm scatter charts! The charts are a great way to visualize many measurements across a limited number of categories.
Here is a swarm chart of wind speed versus hour of day. The chart is created with just two lines of MATLAB code (and a few more for formatting the plot). This plot uses data from the weather station on top of the parking garage at the MathWorks Apple Hill location in Natick (Channel 12397).
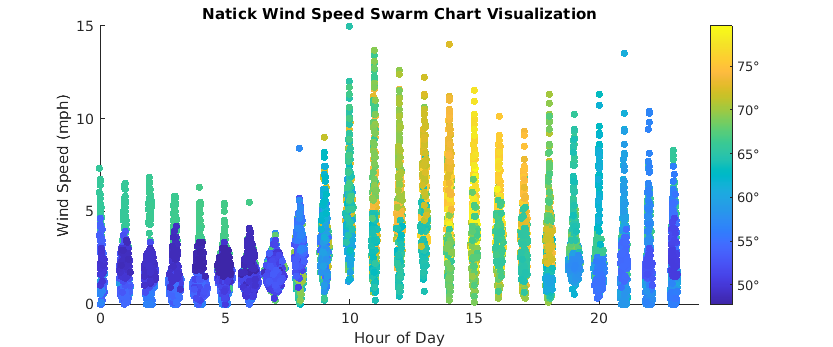
Since the weather station also includes temperature, I’ve color-coded the points using the temperatures for the day.
To create this chart in ThingSpeak, select the MATLAB Visualizations app, and create a new visualization. You can use this code as a start, change the channel ID to whatever channel you want to read.
% Read the data from ThingSpeak into a timetable and create the plot.
myData = thingSpeakRead(12397,'daterange',...
[datetime('now')-days(14) datetime('now')-days(9)],'outputformat','timetable');
swarmchart(hour(myData.Timestamps),myData.WindSpeedmph,30,...
myData.TemperatureF,'filled')

% Create the swarmplot with appropriate labels and limits
xlim([0, 24]);
xlabel('Hour of Day');
ylabel('Wind Speed (mph)');
title('Natick Wind Speed Swarm Chart Visualization');
c = colorbar();
c.TickLabels = c.TickLabels + "\circ";

% Change the aspect ratio.
set(gcf,'units','points','position',[0,0,600,250]);


See Also
-

R2020b: swarmchart
Blogs
-
-
-
Comments
To leave a comment, please click here to sign in to your MathWorks Account or create a new one.