Vectorizing Graphics Operations
Let's talk about changing characteristics of elements in a plot today. I will use an example derived from one in Mapping Toolbox. My goal is to show you good ways to modify your graphics.
Contents
Set Up
First I put the examples directory onto my path so I can get the shape file containing state borders as polygons.
addpath(fullfile(userpath, 'Examples','mapexgeo'))
Read the USA high resolution data
states = shaperead('usastatehi','UseGeoCoords',true);
Create a SymbolSpec to display Alaska and Hawaii as red polygons.
symbols = makesymbolspec('Polygon', ...
    {'Name','Alaska','FaceColor','red'}, ...
    {'Name','Hawaii','FaceColor','red'});
Create Base Map
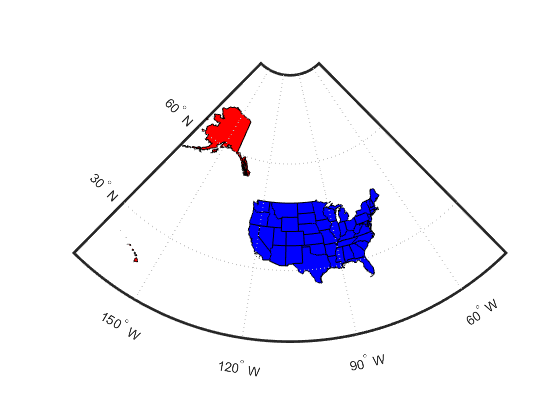
Create a worldmap of North America with Alaska and Hawaii in red, all other states in blue.
figure
worldmap('north america')
statePatches = geoshow(states,'SymbolSpec',symbols, ...
    'DefaultFaceColor','blue','DefaultEdgeColor','black')
axis off
statePatches =
  Group with properties:

    Children: [51×1 Patch]
     Visible: 'on'
     HitTest: 'on'

  Use GET to show all properties

Change One State Color
We can change the color of one state using the easy dot-notation. And a different way to find out about the states.
statePatches.Children(17).FaceColor = 'y';
states(17).Name
ans =
Kentucky

Change Another One
And I can change a state color to a custom one instead.
statePatches.Children(42).FaceColor = [0.2, 0.8, 0.7];
states(42).Name
ans =
Tennessee

Set All States' Patches to One Color
Now change all the states' colors to magenta. In this case, I have to assemble all of the patches together, into a comma-separated list for the left-hand side. And I need to make sure I have as many outputs from the right-hand side, hence the use of deal.
[statePatches.Children.FaceColor] = deal('m');

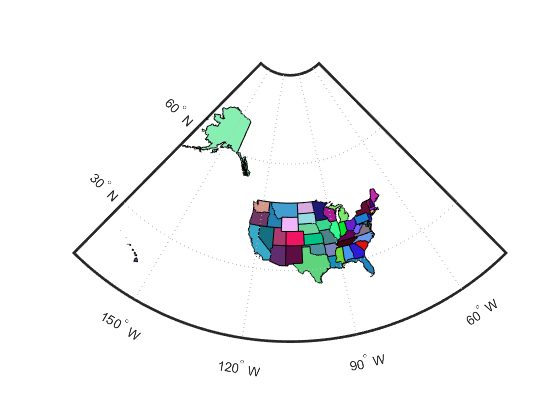
Now change each state to different colors. Let's make an array of colors first.
stateColors1 = rand(length(states),3);
stateColors2 = fliplr(stateColors1);
Change Each State to a Different Color - for loop
We can do this with a loop, of course. Even though this is a relatively small example, let's time it for fun.
tic
for npatch = 1:length(states)
    statePatches.Children(npatch).FaceColor = stateColors1(npatch,:);
end
colorTimes = toc;

We can also do this in a vectorized way, which can provide a huge time savings if there are enough patches involved. In this case, with 51 patches, time is not really a big issue. We have seen customers improve the speed of their code tremendously with scenes that are much more complicated.
What we need to do is not set each color separately. Instead we use the "old-fashioned" function set, and take advantage of the vectorization it offers. What I have to do is pass in an array of handles. Also, I enclose the property (or properties) I want to adjust in a cell array. And I supply the inputs for each handle as elements of a matching cell array. This requires that I convert my triplets for RGB into cells. And I can do that readily with num2cell.
Change Each State to a Different Color - set
Here we go.
tic
set(statePatches.Children, {'FaceColor'}, num2cell(flipud(stateColors2),2));
colorTimes(2) = toc
colorTimes =
     0.052154     0.026216

Conclusion
Sometimes vectorization for graphics happens with no major effort. Like changing every patch to a single color. Using the notation introduced with the updated graphics system is easy and your code is highly readable.
Sometimes for performance, there may be instances where vectorizing is still appropriate, and you can't get it with the new notation. In that case, you will need the various techniques and functions I used in this post. Will this be helpful to you? Please share your thoughts on this here.


Comments
To leave a comment, please click here to sign in to your MathWorks Account or create a new one.