
Colorbars for filled contours
This weeks pick adds very useful functionality for anybody who works with filled contour plots (as created by contourf). MATLAB's standard colorbar isn't particularly well suited to filled contours, since it displays ever color in the colormap while the filled contour plot uses a smaller subset of colors. Blair Greenan's COLORBARF creates a colorbar that displays only the colors contained in the filled contour plot.
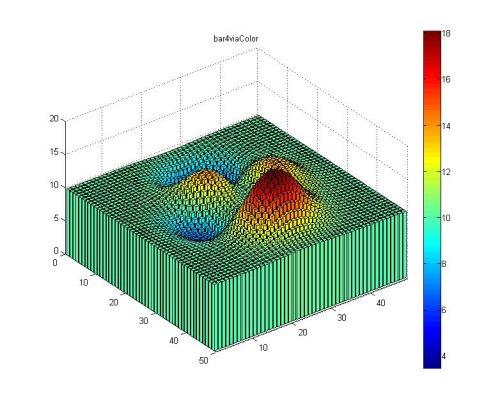
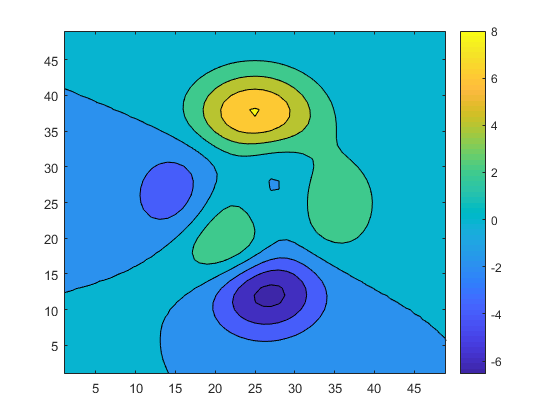
The figures below show the difference between COLORBAR and COLORBARF:
One tiny caution if you are using MATLAB 7 (R14). To ensure compatibility with COLORBARF, use the new 'v6' flag when calling CONTOURF, e.g.
[cout,H]=contourf('v6',peaks);
colorbarf(cout,H)
One more thing - are you impressed that I made it through this entire posting without making a snide comment about the name Blair chose for this function?


댓글
댓글을 남기려면 링크 를 클릭하여 MathWorks 계정에 로그인하거나 계정을 새로 만드십시오.