
Data Explorer for your 3-D scalar data
Jiro's pick this week is Volumetric Data Explorer by my fellow MathWorker, Adam Filion.
Volume visualization refers to a graphical representation of data sets defined on three dimensional grids. There are two types of volume data sets that MATLAB typically deals with - scalar and vector data. Scalar data contain scalar information at every three dimensional grid points, much like temperature.
$T = f(x,y,z)$
Vector data contain three values at each grid point, much like wind flow.
$[u,v,w] = f(x,y,z)$
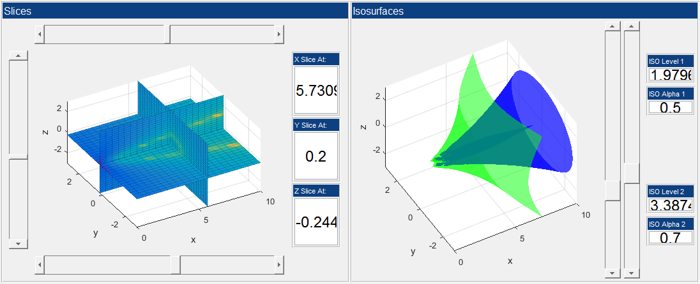
There are many functions for visualizing volume data. Adam's Volumetric Data Explorer is an app that lets you interactively visualize scalar data, using some of these builtin functions under the hood. Here are some of the cool things about this app.
- The app lets you visualize orthogonal slices and isosurfaces of scalar data. Slices let you cut into your scalar data, and isosurfaces show you the surfaces with equal values, sort of like contour lines but for volume data.
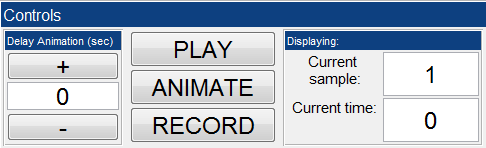
- If you provide an additional dimension (time), the app will animate the data along the time.
- You can create recordings (AVI and MP4) of the animations. The app comes with a wealth of options for specifying animation frames, frame rates, recording regions, etc.
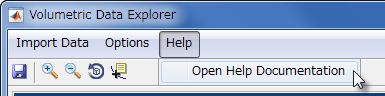
- The app comes with a detailed documentation, which you can access from the help menu.
I remember seeing one of the first versions of this app several years ago, and Adam has been adding feature after feature since then. Thanks for a great app, Adam!
Comments
Give this a try and let us know what you think here or leave a comment for Adam.
- Category:
- Picks


Comments
To leave a comment, please click here to sign in to your MathWorks Account or create a new one.