R2017a: heatmap
Jiro‘s pick this week is the new heatmap function introduced in R2017a.
Last month, a new release of MATLAB (R2017a) came out with many new features. Of those, I’d like to highlight heatmap, which over the years had predecessors created by the user community.
Meet heatmap
Heatmap charts display data as an image where each element is represented by a color. The value of the element is also displayed on the image. As a simple example, let’s visualize a magic square.
m = magic(15);
heatmap(m);
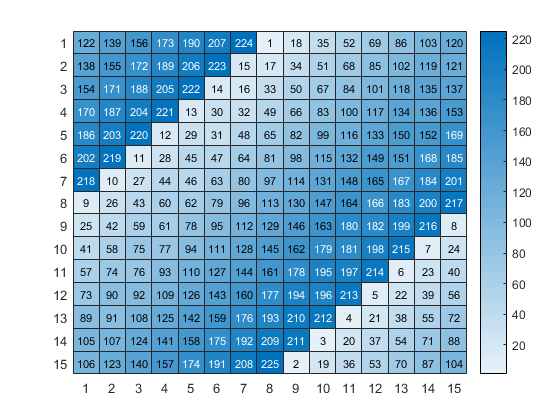
You can imagine that if the size of the matrix is large, or if the figure is resized to a small window, the image can quickly become crowded with a lot of text. No need to worry. The heatmap intelligently turns off the text display when it makes sense to do so.
set(gcf,'Position',[100 100 400 350])
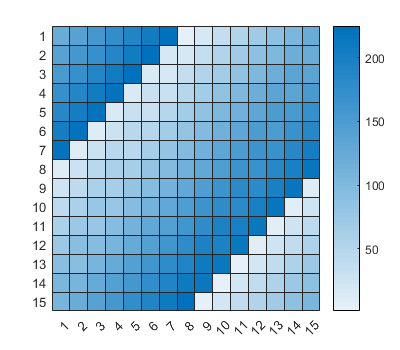
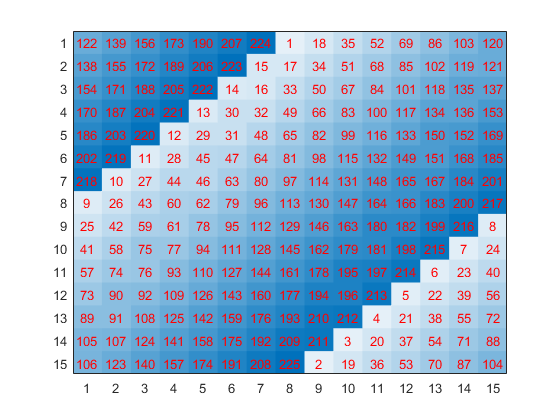
heatmap returns a HeatmapChart object, which you can use to customize.
figure
hMap = heatmap(m);
hMap.ColorbarVisible = 'off';
hMap.CellLabelColor = 'red';
hMap.GridVisible = 'off';
Another feature of heatmap that I like is the ability to pass a table data. For tables, you specify the x and the y variables, and the function will calculate and display the aggregated result, such as the count, of the various x-y combinations.
For example, if we have a table of data for 100 people with information about whether they smoke and their self-assessed health status, we can group them into the various categories and visualize as a heatmap.
load patients
tbl = table(Age,Gender,SelfAssessedHealthStatus,Smoker,Weight,Location);
heatmap(tbl,'Smoker','SelfAssessedHealthStatus');
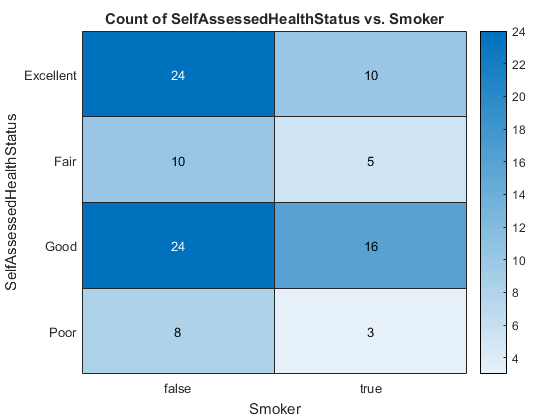
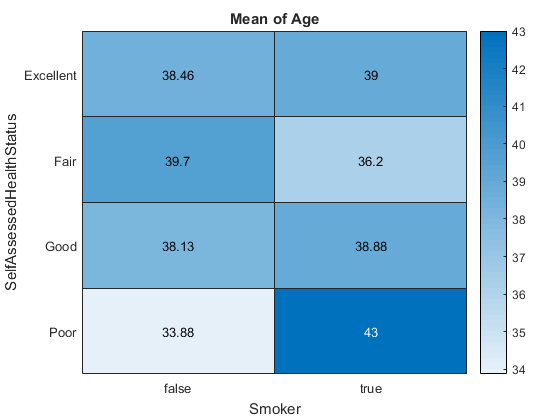
Instead of showing the aggregated count, we can choose to display the average age for each category.
heatmap(tbl,'Smoker','SelfAssessedHealthStatus', ...
    'ColorVariable','Age');
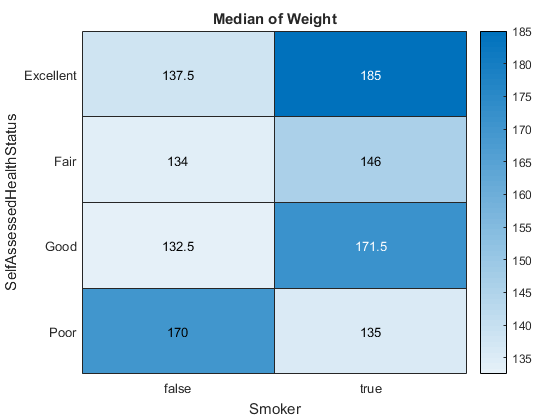
Or the median weight.
heatmap(tbl,'Smoker','SelfAssessedHealthStatus', ...
    'ColorVariable','Weight','ColorMethod','median');
For Previous Releases
If you haven’t upgraded or cannot upgrade to R2017a, you can check out some of the user-submitted entries. One of my favorites is Customizable Heat Maps by Ameya, a former collegue of mine.
Comments
If you have R2017a, give it a try and let us know what you think here!
- Category:
- Picks


Comments
To leave a comment, please click here to sign in to your MathWorks Account or create a new one.