
R2018b Features
Sean‘s pick this week is my biannual review of former picks that are now part of the product. R2018b shipped last week bringing with it a few new things I really like.
Contents
Subplot Title (!)
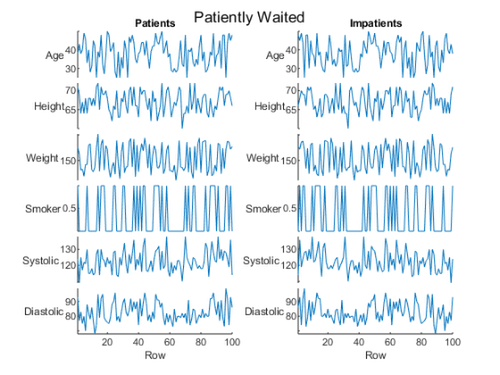
Have you ever wanted to add a title above your subplots?
There has been a function called suptitle in the demos section of the Bioinformatics Toolbox for quite some time. While not formally documented, it provided a convenient way to add a “super title” to a plot, if you have that toolbox. Numerous File Exchange entries and pick of the weeks have filled this gap for over 20 years. In R2018b, there is finally(!) sgtitle. I’ll showcase it using another new function called stackedplot for plotting many responses to one independent variable or for plotting tables/timetables.
T = readtable('patients.dat');
subplot(1, 2, 1)
stackedplot(T);
title('Patients')
subplot(1, 2, 2)
stackedplot(flip(T));
title('Impatients')
sgtitle('Patiently Waited')
drawnow
Draw a Line
The File Exchange entries for vertical and horizontal lines have also been around for a long time. R2018b introduces xline and yline for drawing constant lines on your plots that rescale with the axes zoom/pan.
t = dateshift(datetime('yesterday'),'start','day'):hours(1):dateshift(datetime('tomorrow'),'end','day');
y = cumsum(rand(size(t)));

figure
plot(t, y)
xline(datetime('now'), 'Label', "Now");
yline(20, '--', "20");

Convert App Designer App to Class
There is a well rated File Exchange entry called mlapp2classdef which parses the undocumented format to convert an app designer app to a standalone class definition file. This workflow is nice for working with source control systems or when you want to use the regular editor. That capability is now part of R2018b’s app designer and can be accessed from Save -> Export to *.m File. Note it does not allow “round-tripping” so you cannot pull a modified class file back into app designer; though you could copy parts of the code back into the app designer editor.
STL Read and Write
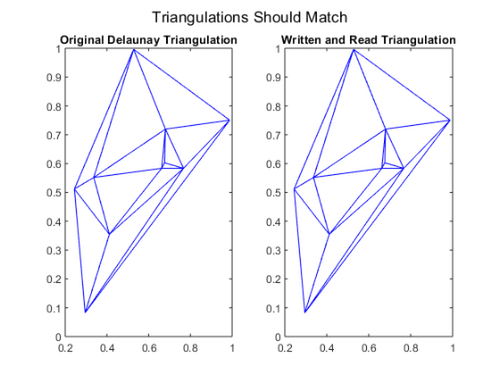
There are numerous readers and writers on the File Exchange (and in MathWorks’ Toolboxes) for Stereolithography (STL) files. There are now functions stlread and stlwrite in base MATLAB for this.
xy = rand(10, 2);
dt = delaunayTriangulation(xy);
filename = tempname + ".stl";
deleter = onCleanup(@()delete(filename));
stlwrite(dt, filename);

figure
subplot(1, 2, 1);
triplot(dt);
title("Original Delaunay Triangulation");
subplot(1, 2, 2);
triplot(stlread(filename));
title("Written and Read Triangulation");
sgtitle("Triangulations Should Match")
Other
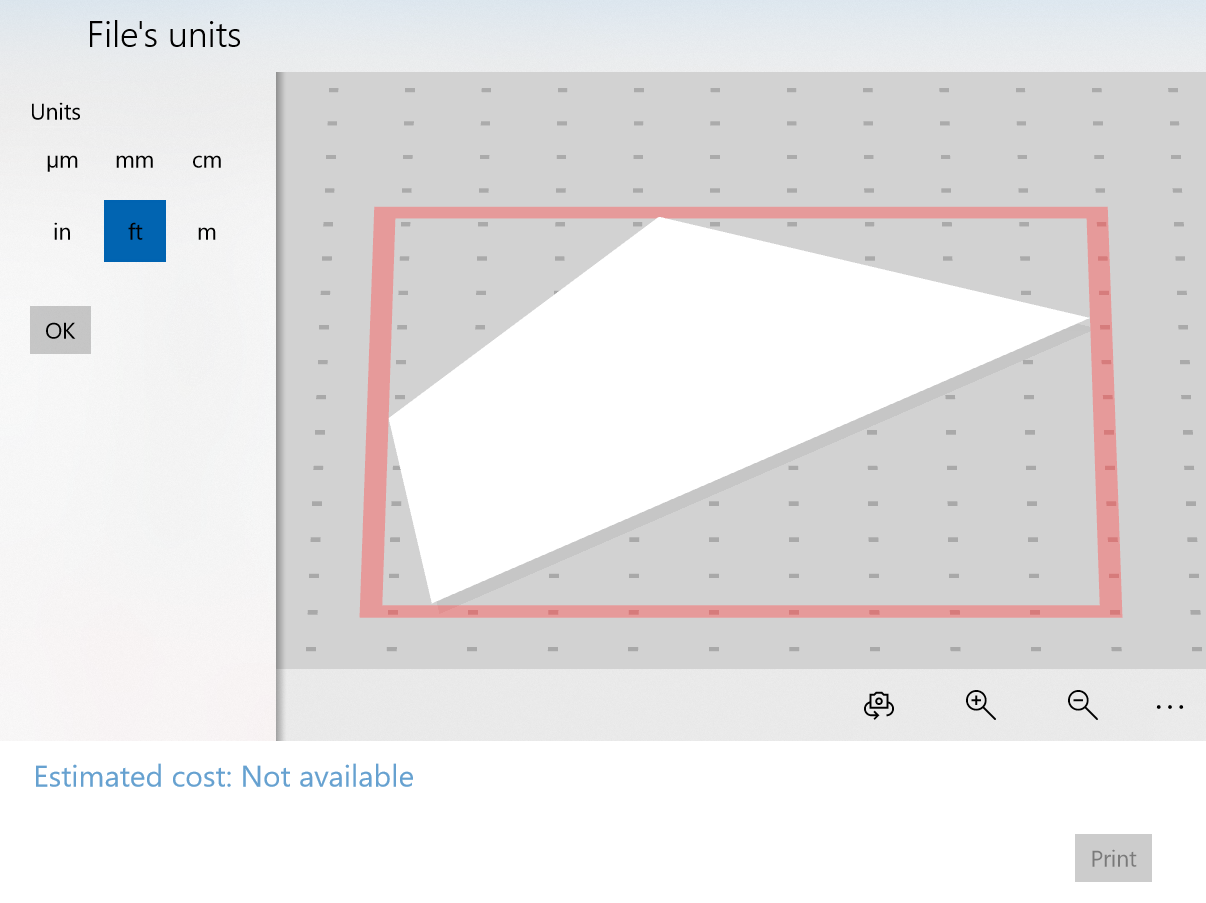
Of course there are many other nice things as well. One that I like is that most functions now support strings. So if I want to open that STL file for 3D printing outside of MATLAB, I can without having to convert to char or cellstr.
winopen(filename)
Comments
Give R2018b a try and let us know what you think about these or any other features here.
Published with MATLAB® R2018b
- カテゴリ:
- Picks


See Also
-

R2020b
Blogs
-
MATLAB R2020a
Blogs
-

MATLAB R2012a
Blogs


コメント
コメントを残すには、ここ をクリックして MathWorks アカウントにサインインするか新しい MathWorks アカウントを作成します。