
Climate Change Leads to a Predictable Atmosphere: Is this Good News?
Today's post is by Lama Itani, who is part of the MathWorks Academic Engineering Team.
This week's Pick is Attractor Local Dimension and Local Persistence computation by Davide Faranda. This code reproduces some of the results from the journal article he authored.
Have you ever wondered why weather forecasting is limited to few days? Studies have shown that our atmosphere is unpredictable due to its chaotic nature, which makes weather modeling extremely challenging. Our atmosphere, however, has been undergoing significant changes due to ocean warming. The latter is driven by the yearly increase of absorbed anthropogenic greenhouse gases.
Does a warming ocean improve weather prediction?
To answer this intricate question, a group of European scientists used a novel method, based on dynamical systems theory, to compute changes in weather predictability using sea-level pressure data from the North Atlantic spanning between 1850-2100. Characterizing predictability of the atmospheric system relies on determining 2 variables: local dimension, d, and local persistence, θ. The novelty in the methodology is that it removes major uncertainties associated with past estimates and it yields the full probability distribution of the local dimension. The researchers found that the local dimension decreased, in 2 out of 3 observed datasets, as the global temperature increased. In addition, their simulations based on 4 climate change model ensembles revealed that an increase in ocean temperature leads to a significant decrease in local dimension. When the latter is low, this means that the system is very predictable therefore facilitating weather modeling. Is this good news? Not at all! Our atmosphere is inherently chaotic and a less chaotic one signifies that our natural system has undergone a major disruption.
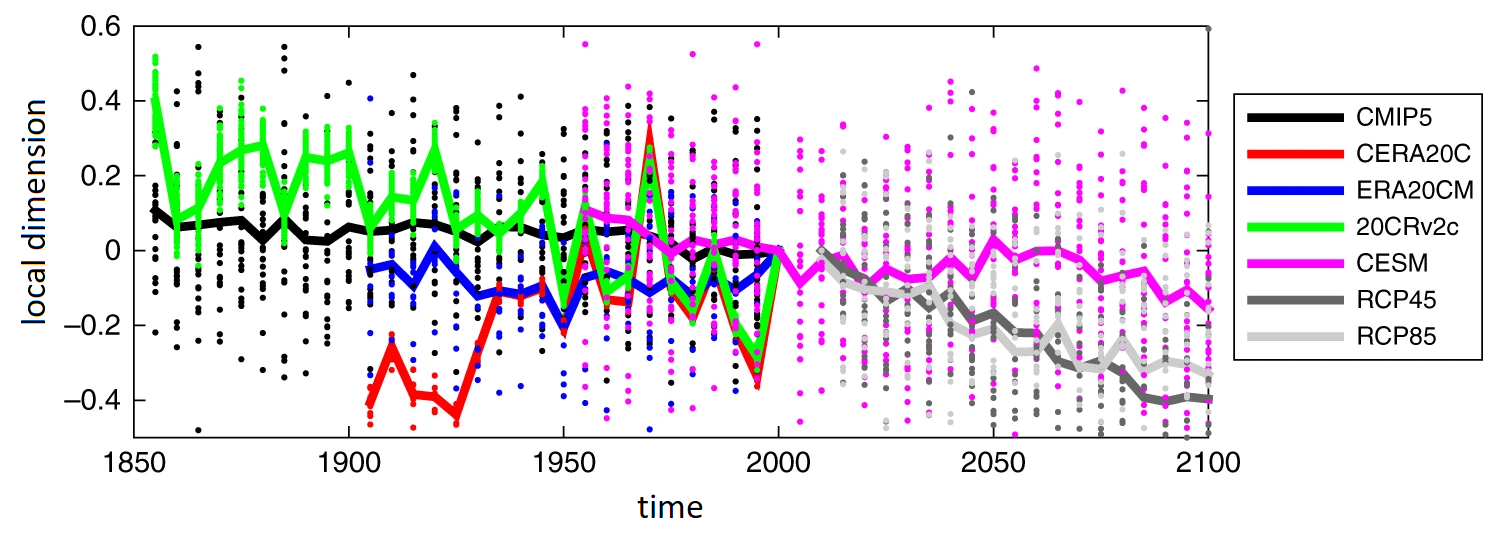
Local dimension (minus its value in Y2000) for all observed datasets (CERA20C, ERA20CM, 20CRv2C) and models (CMIP5, CESM, RCP45 and RCP85). Lines = overall mean. Points = values of each member of the set [1].
To know more on how local dimension and persistence of a system are calculated, refer to Davide's File Exchange entry.
Comments
Let us know what you think here or leave a comment for Davide.
[1] Davide Faranda, M Carmen Alvarez-Castro, G Messori, D Rodrigues, P Yiou. The hammam effect or how a warm ocean enhances large scale atmospheric predictability. Nature Communications, March 2019. DOI: 10.1038 / s41467-019-09305-8
- 범주:
- Picks


댓글
댓글을 남기려면 링크 를 클릭하여 MathWorks 계정에 로그인하거나 계정을 새로 만드십시오.