
Figures for Dark Mode
Do you work in dark mode? If you do, you need to take a look at this entry by Natan, especially if you make presentations using the dark theme. As you know, standard plots in MATLAB are created with white background.
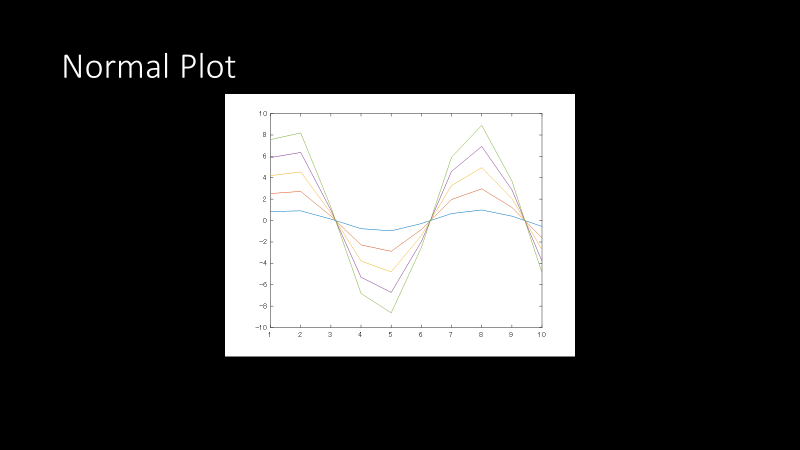
figure
plot((1:2:9).*sin((1:10)'))

If we copy and paste this into a dark theme presentation, it's probably not what you want.
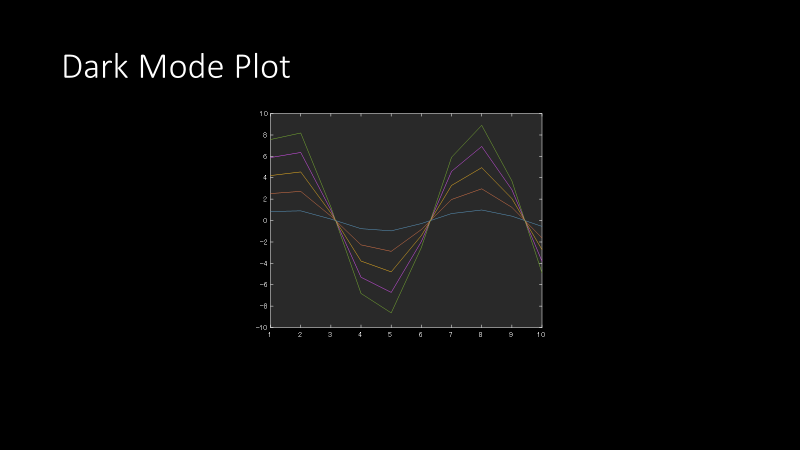
Just run plot_darkmode and it does the appropriate color conversions. The background is set to a dark theme, the text and axes colors are set to white, and the line colors are adjusted accordingly.
plot_darkmode

Copy and paste into a slide, and voila!
It's also worth noting that the line colors are adjusted so that they are appropriately visible in dark mode. For instance, let's create a plot with two lines, a black line and a dark red line.
plot(rand(5,1),"k","LineWidth",2) % black line
hold on
plot(rand(5,1),"Color",[.5 0 0],"LineWidth",2) % dark red line
hold off
legend("Data 1", "Data 2")

You can imagine that simply setting the background to a dark theme will not work. Both lines will be hardly visible. When we run plot_darkmode, you can see that the line colors are adjusted appropriately.
plot_darkmode

Comments
Very nice entry, Natan!
- カテゴリ:
- Picks


コメント
コメントを残すには、ここ をクリックして MathWorks アカウントにサインインするか新しい MathWorks アカウントを作成します。