
MATLAB Zoomed Axes: Showing zoomed-in regions of a 2D plot
Mike's pick this week is Zoomed Axis by Caleb Thomas.
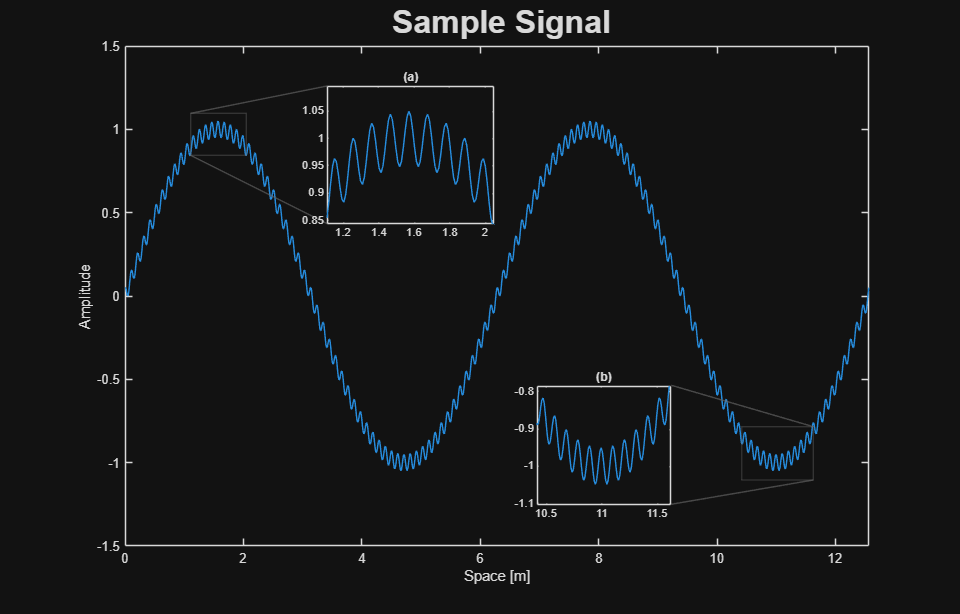
Often, when we show a plot, there is some region that's of particular interest and so we want to zoom in on it and show that as well. Zoomed Axis is a new MATLAB add-on by Caleb Thomas that allows you to do exactly that. Here's an example
% Create dummy data
x = linspace(0,4*pi, 1201);
y = sin(x) + cos(60*x)/20;
% create figure and plot
f = figure('position', [696 276 960 614]);
ax = axes(f, 'position', [0.1300 0.1100 0.7750 0.8150]);
% plot data
ph = plot(x, y);
% set axis range and labels
ax.XLim = [min(x), max(x)];
ax.XLimMode = 'Manual';
title(ax, ' Sample Signal', 'fontsize', 24);
xlabel(ax, 'Space [m]');
ylabel(ax, 'Amplitude');
% create first zoomed object
zoomed_region = [0,0,1,1];
zax1 = zoomed_axes(ax, zoomed_region);
zax1.Position = [0.341, 0.635, 0.174, 0.225];
zax1.ZoomRegion = [1.110, 0.844, 2.049, 1.096];
title(zax1, '(a)');
% create second zoomed object
zax2 = zoomed_axes(ax, zoomed_region);
zax2.Position = [0.559, 0.178, 0.140, 0.194];
zax2.ZoomRegion = [10.417, -1.104, 11.626, -0.784];
title(zax2, '(b)');
The zoom-in regions are also fully interactive as shown in this video
The project has already attracted the enthusiastic interest of Adam Danz, author of the MATLAB Graphics and App Building blog who gave it a shining review.
Zoomed Axes is open source and available on GitHub, File Exchange and directly in MATLAB via the Add-Ons panel.
- Category:
- Graphics/Visualizations,
- Picks


Comments
To leave a comment, please click here to sign in to your MathWorks Account or create a new one.