
Sankey diagrams in MATLAB
Sankey diagrams visualize flows, of energy, money, materials, people, anything that moves from one place to another, where the width of each arrow is proportional to the quantity flowing. According to Wikipedia, Sankey diagrams are named after Irish Captain Matthew Henry Phineas Riall Sankey, who used this type of diagram in 1898 in to show the energy efficiency of a steam engine.
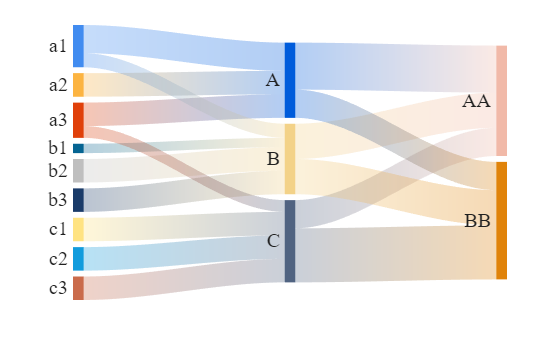
slandarer's file exchange entry brings these diagrams to MATLAB and they are beautiful! Here are a few examples from the package taken from the 20+ included
links={'a1','A',1.2;'a2','A',1;'a1','B',.6;'a3','A',1; 'a3','C',0.5;
'b1','B',.4; 'b2','B',1;'b3','B',1; 'c1','C',1;
'c2','C',1; 'c3','C',1;'A','AA',2; 'A','BB',1.2;
'B','BB',1.5; 'B','AA',1.5; 'C','BB',2.3; 'C','AA',1.2};
SK = SSankey(links(:,1), links(:,2), links(:,3));
SK.draw()
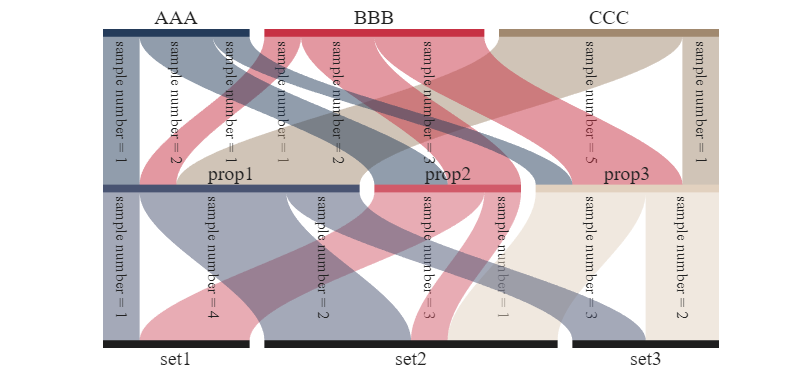
%% sankey demo20 :Rotate the Sankey diagram by 90 degrees to make it vertical
figure('Name','sankey demo20', 'Units','normalized', 'Position',[.05,.1,.4,.7])
A12 = [1,2,1; 1,2,3; 5,0,1];
A23 = [1,4,2; 3,1,0; 0,3,2];
adjMat = mergeAdjMat({A12, A23});
SK = SSankey([],[],[], 'AdjMat',adjMat);
SK.NodeList = {'AAA','BBB','CCC','prop1','prop2','prop3','set1','set2','set3'};
SK.RenderingMethod = 'left';
SK.ValueLabelLocation = 'left';
SK.ValueLabelFormat = @(X) ['sample number = ',num2str(X)];
SK.ColorList = [ 36, 59, 90; 199, 49, 68; 161,137,111;
73, 84,114; 209, 90,105; 226,209,191;
30, 30, 30; 30, 30, 30; 30, 30, 30]./255;
SK.Align = 'down';
SK.draw()
SK.setLabelLocation(3, 'right')
SK.setLink(1:15, 'FaceAlpha',.5)
% Rotate the entire diagram to vertical orientation
rotateSankey(SK)
The package has been downloaded thousands of times and slandarer has been very responsive to user requests in the discussions and review sections of the file exchange entry leading to several new versions since it's first release in 2023.
- Category:
- Graphics/Visualizations,
- Picks






Comments
To leave a comment, please click here to sign in to your MathWorks Account or create a new one.