Spring 2009 MATLAB Contest: Data Visualization
The Spring MATLAB programming contest has just begun. This contest is different from contests in the past, so I recommend you start by reading the contest rules. This contest is less about algorithms and tweaking (although I'm sure that will happen), and more about visualizing an interesting data set. The data set for this contest is previous contest data! I took a crack at it and submitted my own visualization.
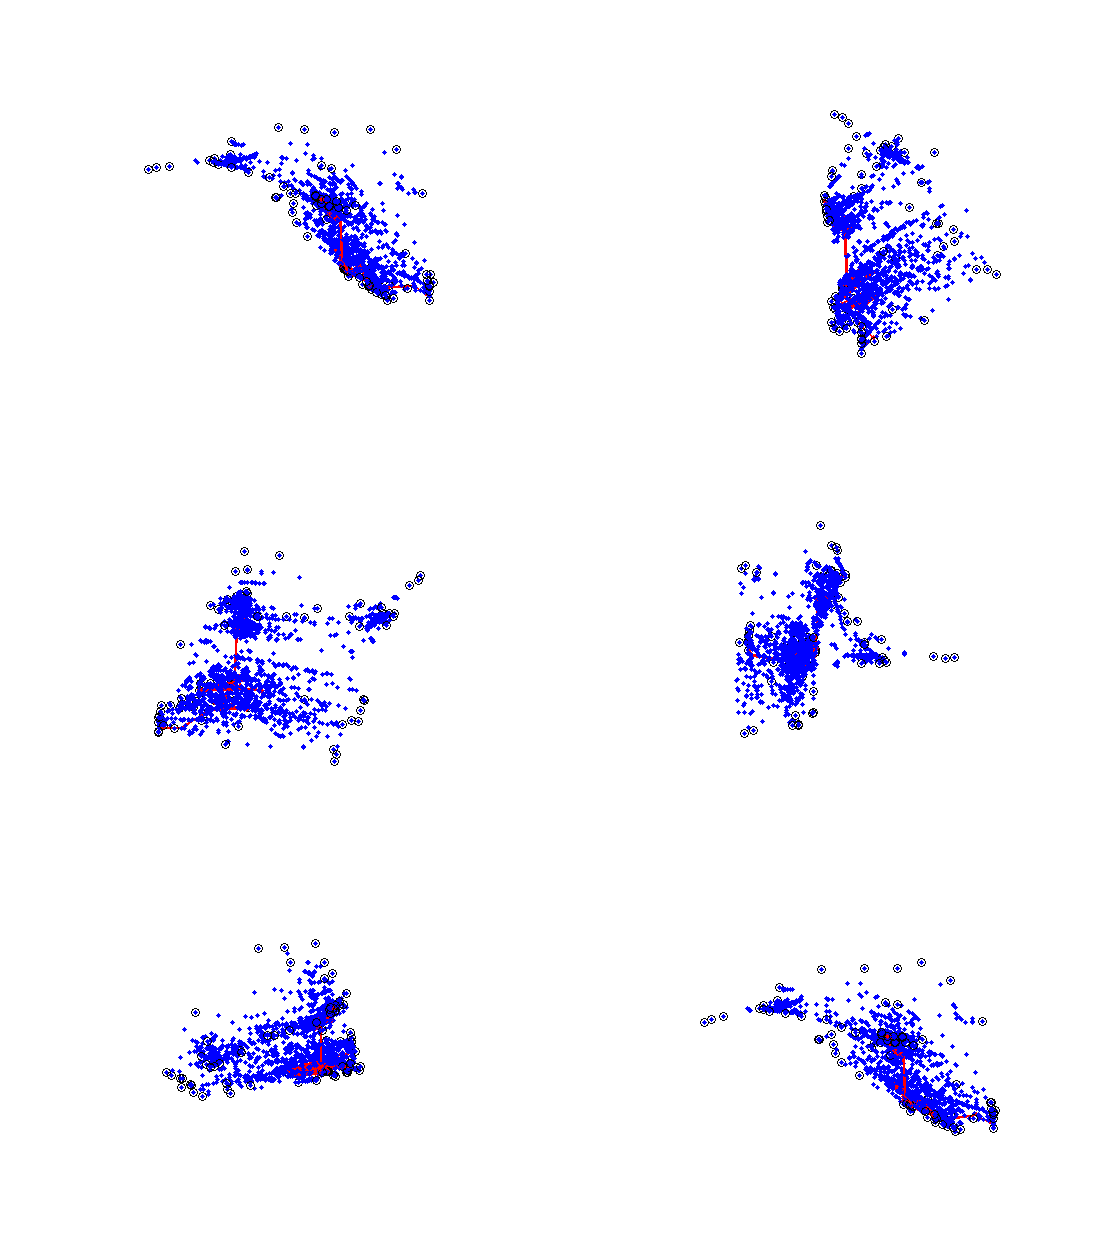
I wanted to look at the underlying space of two factors that went into the overall score for the contest, and see how they related to the length of the entry. The main factors that affect score are the result, complexity and the CPU time. I chose result, cpu_time and the nodeCount for my visualization. This is perfect for a 3-D scatter.
Here is the result of my visualization, animated to get the full 3-D effect.

Take a look at Doug's contest blog post for other ideas on how to visualize this data.
- カテゴリ:
- Challenge,
- Community,
- Fun


コメント
コメントを残すには、ここ をクリックして MathWorks アカウントにサインインするか新しい MathWorks アカウントを作成します。