
Executing Stateflow Charts in MATLAB
In MATLAB R2019a, it is now possible to create standalone Stateflow charts that can be executed in MATLAB. Let's see how this work!
Getting Started
First, an important concept: A standalone Stateflow chart is a MATLAB class. The difference is that you edit it using the Stateflow graphical language instead of MATLAB code.
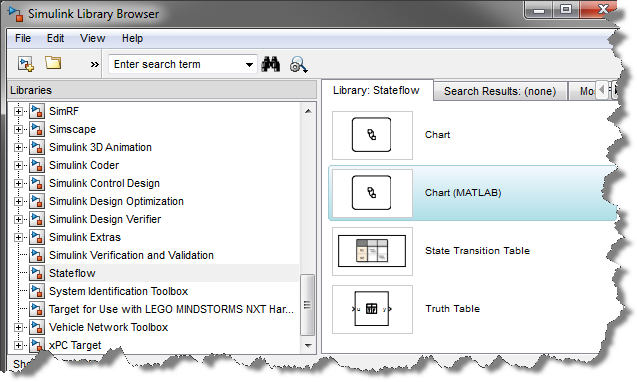
To get started, use the Stateflow Chart entry under the New button in the MATLAB toolstrip:

The simplest example I can think of is the following, where I increase the value of a local variable "x" every time the chart executes.
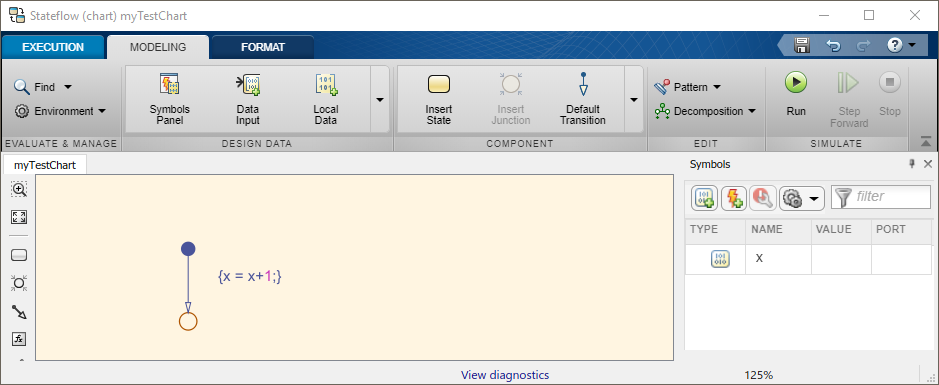
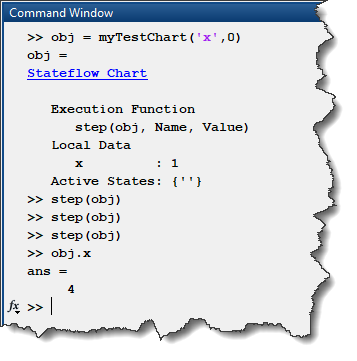
I can execute this chart by first creating a chart object obj and initializing the value of x to zero. Then I can call the chart step method as many times I want and observe how the value of x increases.
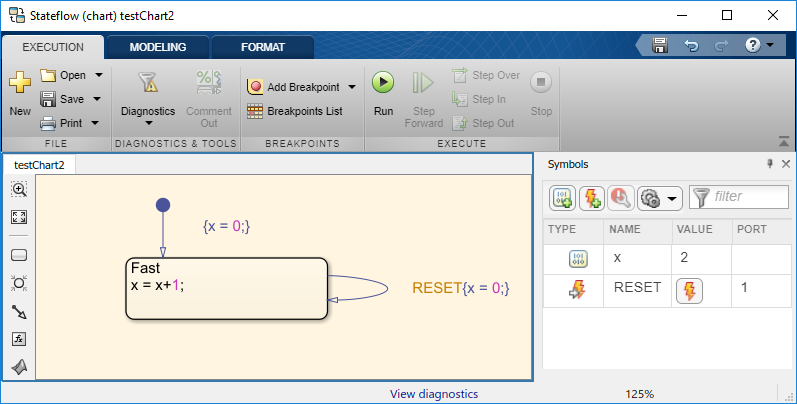
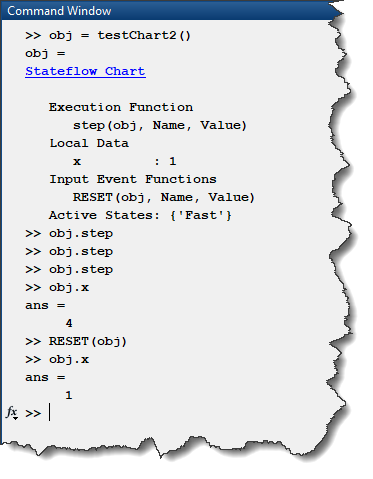
You can also add Event Inputs to charts, and they result in methods for the MATLAB class. In the following chart, I defined a RESET event and use it to reset the value of local variable x:
Designing MATLAB Apps logic in Stateflow
One of the things I like the most about standalone Stateflow Charts is that they team up very well with MATLAB Apps created using the App Designer.
Let's extend our previous example a little bit. In App Designer, I created this simple App:
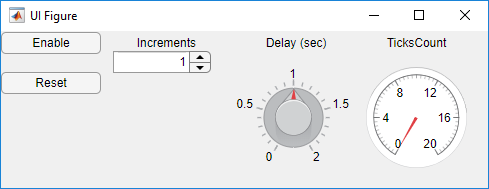
My goal is that when I click the Enable button, the value displayed on TicksCount gauge will begin to increase by Increments and keep increasing every Delay. If I click the Reset button, TicksCount goes back to zero.
How does this work?
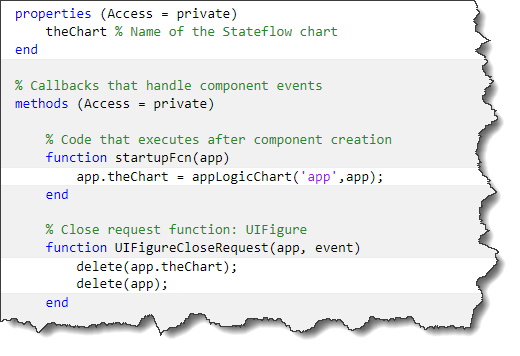
To connect the app with the Stateflow chart, they both need to know about the other one. On the app side, you can create a private property storing a handle to the chart. On the Stateflow side, you need to create a local variable that will contain a handle to the app. That way each of them will be able to call the other.
In App Designer, the code will look like the following. The startupFcn initializes the Stateflow chart named appLogicChart and passes it the handle to the app. The chart object is then stored in the app property theChart.
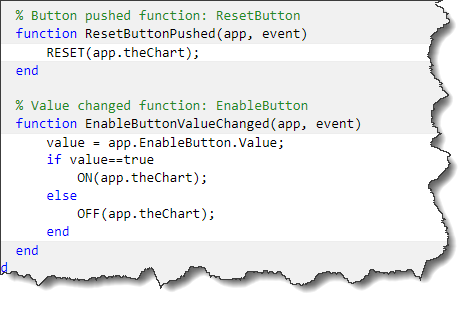
With that done, the buttons in the app can call events in the chart.
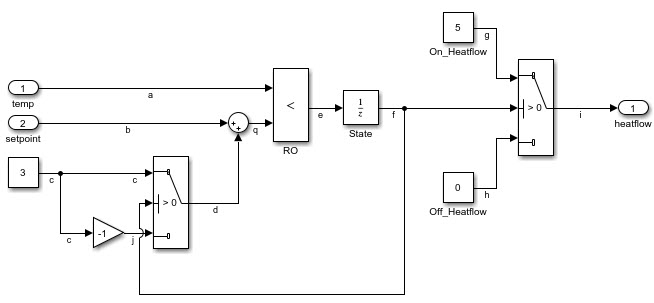
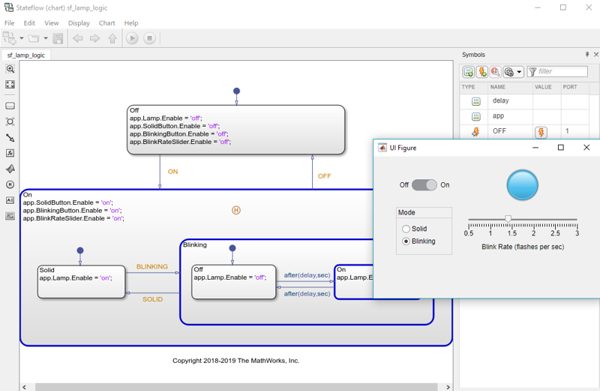
At the same time, the chart can access the various properties of the app through its handle. Thanks to the Stateflow animation, it becomes very convenient to debug the logic in your app:

One important thing to point out in the above chart is the usage of the after keyword. Under the hood, the chart sets up MATLAB timer to implement the temporal logic. In my opinion, this makes it the simplest way to use timers in MATLAB.
Now it's your turn
If you are interested in this new feature, I recommend going through the Execution in MATLAB section of the Stateflow documentation.
We are curious to hear how you are going to leverage standalone Stateflow charts... Let us know in the comments below!
Personally, I may never write a MATLAB class in the MATLAB Editor ever again!
- Category:
- Stateflow,
- What's new?


See Also
-
Simulink-to-Stateflow
Blogs
-
-
-
Comments
To leave a comment, please click here to sign in to your MathWorks Account or create a new one.