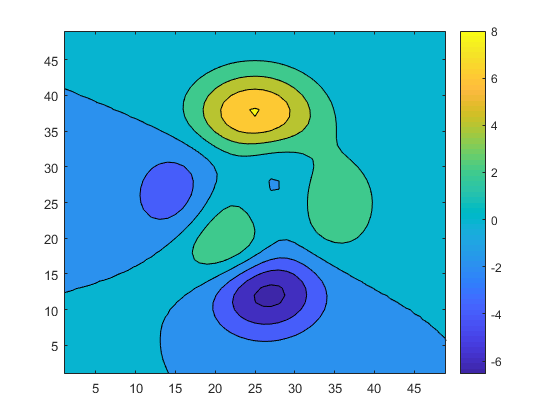
Setting the colormap to be consistent across axes.
I love getting short, concise questions from fellow MATLAB users. One that I got recently looked like this:
I have some data that I want to plot with contourf using a colormap that spans from 0 to 1, but with everything I have tried the range keeps resetting to the range of the current data being plotted. I want a constant colormap range so that I can accurately compare plots with data that span different ranges.This is a question that is applicable to many people, in different situations. The short answer is that you set the CLIM property of the axes. The long answer is in the video!


댓글
댓글을 남기려면 링크 를 클릭하여 MathWorks 계정에 로그인하거나 계정을 새로 만드십시오.