File Exchange Pick of the Week

December 13th, 2007

Practical Example: Visualizing the density of a data cloud

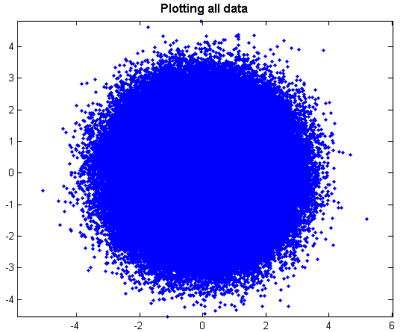
I was working with a MATLAB user that had a large number of data points in the form of x,y,z triples. He was mostly interested in the density of these data points over the range of the data. At first he tried to just do a scatter plot, but there was too much data to comprehend. Instead, I had him do a few different visualizations using histograms and Sliceomatic (download it here).

Video Content

Find the files here.

Other videos have been gathered here:
http://blogs.mathworks.com/pick/category/video/

Practical example videos have been gathered here:
http://blogs.mathworks.com/pick/category/practical-example

One Response to “Practical Example: Visualizing the density of a data cloud”

  1. Mike Briggs replied on :

    Very useful! Thanks for telling us about Sliceomatic.

    Mike Briggs

Leave a Reply

Wrap code fragments inside <pre> tags, like this:

<pre class="code">
a = magic(3);
sum(a)
</pre>

If you have a "<" character in your code, either follow it with a space or replace it with "&lt;" (including the semicolon).


Bob, Brett & Jiro share their favorite user-contributed submissions from the File Exchange.

  • Zach: Hi Doug and Les, I didn’t have a lot of time to mess with this, but I did find a work-around. I plotted...
  • hamed: k
  • Les: @Zach This isn’t exactly what you are looking for but at least it puts all three parameters on the same...
  • Zach: Thanks for your suggestions Doug. I’ll give that a shot and see what happens. I’ve seen many of...
  • Doug: @Zach, I would say to use plotYYY, because that is close to what you want, but using depth as Y makes sense....
  • Doug: @Teja, I think this will work: http://www.mathworks .com/access/helpdesk /help/techdoc/ref...
  • Gify: merry christmas :) nice christmas tree! Regards, Janet Gify
  • Teja: Dear Doug Is there anyway to plot a surface from nonuniform data without meshgrid and griddata? Basically i...
  • Zach: I’m working with geophysical data, so I’d like to produce a depth profile. The y-axis would be...
  • Doug: @Ashok First, please do not use variable names that are MATLAB commands (std and mean). Second, p(j) should be...

These postings are the author's and don't necessarily represent the opinions of The MathWorks.