
Drawing a Circle
You may have noticed some recent changes in the format of this blog. Here’s what to expect on a regular basis – two topics
per week.
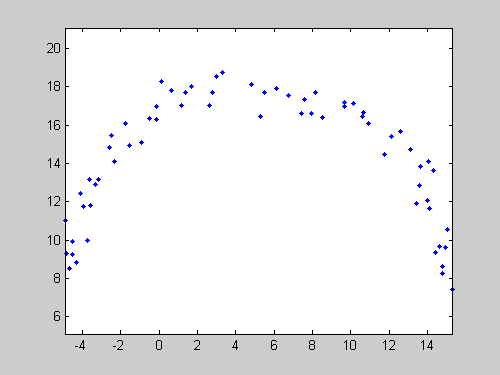
In last week's Pick of the Week, I talked about fitting a circle to a collection of points. With a small example, I showed how Izhak
Bucher's CircFit makes short work of that task. But to visualize the circle I fit through my faked data, I used MATLAB's rectangle command!
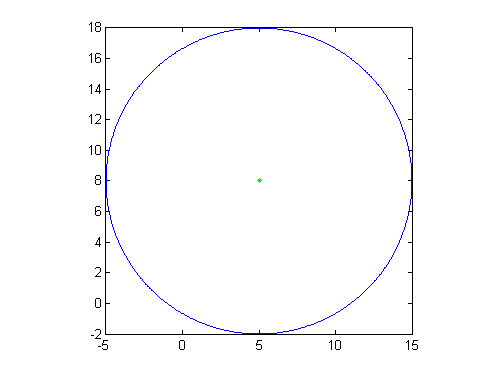
If that seems odd to you, then this week's pick is for you: Zhenhai Wang's Draw a Circle submission lets you visualize your circle with (to me) a much more natural syntax, specifying the coordinates of the center,
the radius of the circle, and the number of points to plot. Optionally, the file also lets you specify the style parameters
for the plotted curve.
For instance:
 Okay, so you may be thinking that plotting a circle with this syntax isn't the most difficult thing you've ever tried to do.
Still, nearly 24,000 people have downloaded Zhenhai's file! This suggests that it might not be trivially easy, either. Or
at least, that it's awfully convenient to be just be the beneficiary of someone else's work. And "Draw a Circle" is pretty
well vetted, too; it has an average of 4.29 (out of 5) stars, from 42 reviews. That means a lot of people are happy with Zhenhai's
effort. In fact, years after its submission, "Draw a Circle" continues to get hundreds of downloads every month (661 in the
past 30 days). Moreover, two other files cite this week's selection as an inspiration. Nice work, Zhenhai!
Got a favorite plotting routine that makes your life easier? Let us know about it!
Okay, so you may be thinking that plotting a circle with this syntax isn't the most difficult thing you've ever tried to do.
Still, nearly 24,000 people have downloaded Zhenhai's file! This suggests that it might not be trivially easy, either. Or
at least, that it's awfully convenient to be just be the beneficiary of someone else's work. And "Draw a Circle" is pretty
well vetted, too; it has an average of 4.29 (out of 5) stars, from 42 reviews. That means a lot of people are happy with Zhenhai's
effort. In fact, years after its submission, "Draw a Circle" continues to get hundreds of downloads every month (661 in the
past 30 days). Moreover, two other files cite this week's selection as an inspiration. Nice work, Zhenhai!
Got a favorite plotting routine that makes your life easier? Let us know about it!
- On Tuesdays Doug will provide MATLAB tutorials.
- On Fridays guest bloggers Jiro, Brett and Bob will highlight File Exchange submissions.
R = 10;
Center = [5,8];
circle(Center,R,1000,'b-');
hold on
plot(Center(1),Center(2),'g.')
Okay, so you may be thinking that plotting a circle with this syntax isn't the most difficult thing you've ever tried to do.
Still, nearly 24,000 people have downloaded Zhenhai's file! This suggests that it might not be trivially easy, either. Or
at least, that it's awfully convenient to be just be the beneficiary of someone else's work. And "Draw a Circle" is pretty
well vetted, too; it has an average of 4.29 (out of 5) stars, from 42 reviews. That means a lot of people are happy with Zhenhai's
effort. In fact, years after its submission, "Draw a Circle" continues to get hundreds of downloads every month (661 in the
past 30 days). Moreover, two other files cite this week's selection as an inspiration. Nice work, Zhenhai!
Got a favorite plotting routine that makes your life easier? Let us know about it!
- Category:
- Picks


See Also
-
Drawing Ellipses
Blogs


Comments
To leave a comment, please click here to sign in to your MathWorks Account or create a new one.