File Exchange Pick of the Week

October 24th, 2008

Displaying Structures

Jiro's pick this week is ANY2CSV by Felix Zoergiebel.

I use structures quite often. It allows me to store heterogeneous information in one variable, and I can have structures within structures as well. Sometimes, I go crazy and make many levels of hierarchy to organize my information.

Let's take a look at this data.

load data
whos
  Name      Size            Bytes  Class     Attributes

  a         4x1              2704  struct              

This is a structure that contains information from a series of stress tests. I can dig into the structure to see its contents...

a(1)
ans = 
     TestName: 'Stress Test One'
    Condition: 'fast'
         Test: [2x1 struct]
a(1).Test(1)
ans = 
     Date: 'May 3'
    Score: 89

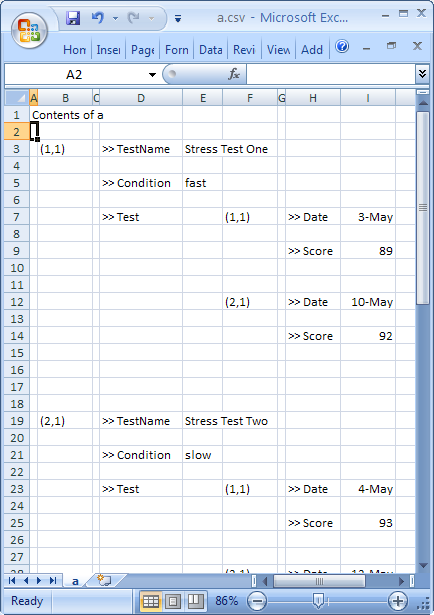
But sometimes, I just want to view everything at once. ANY2CSV allows you to do just that. It flattens the structure and either displays it on the screen or saves it as a CSV file.

any2csv(a, ',', 0, 'a.csv');

Now, I have a summary of the data stored in the structure.

Very nice! I also want to thank Felix for his quick response to my enhancement request. I asked him whether the fields of the structure could be displayed vertically, rather than horizontally, and he updated the submission in a timely manner.

Comments?

Data visualizations don't always come in the form of graphs. We'd love to hear about other interesting ways of viewing information. Tell us about it here.


Get the MATLAB code

Published with MATLAB® 7.7

2 Responses to “Displaying Structures”

  1. Peterslove replied on :

    Hi,
    I have a question for you guys. i ll like to program a simple monte carlo simulation in matlab exclusively showing hardening of a beam. i.e A beam of light incident on a slab of water. To compare the incident and the transmitted spectra to see the effect of hhardening. Can some one help me out there with the matlab codes. Not c or c++

  2. jiro replied on :

    Peterslove,

    I think this is off-topic for this blog (unless you were mistaking MATLAB structures with mechanical structures).

    You should post this question on the CSSM newsgroup, but you may need to rephrase your question a bit. You will have a better chance of getting a response when you ask questions on specific MATLAB tasks, rather than a request for MATLAB code to solve a general problem.

Leave a Reply

Wrap code fragments inside <pre> tags, like this:

<pre class="code">
a = magic(3);
sum(a)
</pre>

If you have a "<" character in your code, either follow it with a space or replace it with "&lt;" (including the semicolon).


Bob, Brett & Jiro share their favorite user-contributed submissions from the File Exchange.

  • Zach: Hi Doug and Les, I didn’t have a lot of time to mess with this, but I did find a work-around. I plotted...
  • hamed: k
  • Les: @Zach This isn’t exactly what you are looking for but at least it puts all three parameters on the same...
  • Zach: Thanks for your suggestions Doug. I’ll give that a shot and see what happens. I’ve seen many of...
  • Doug: @Zach, I would say to use plotYYY, because that is close to what you want, but using depth as Y makes sense....
  • Doug: @Teja, I think this will work: http://www.mathworks .com/access/helpdesk /help/techdoc/ref...
  • Gify: merry christmas :) nice christmas tree! Regards, Janet Gify
  • Teja: Dear Doug Is there anyway to plot a surface from nonuniform data without meshgrid and griddata? Basically i...
  • Zach: I’m working with geophysical data, so I’d like to produce a depth profile. The y-axis would be...
  • Doug: @Ashok First, please do not use variable names that are MATLAB commands (std and mean). Second, p(j) should be...

These postings are the author's and don't necessarily represent the opinions of The MathWorks.