
Breaking a plot to improve visualization
Contents
Suppose you wanted to plot data that spanned two distinct ranges of your dependent variable. Showing all the data on a single plot would waste valuable real estate, and changing to a log scale might obscure some of your data. Classically, you might think of using the SUBPLOT function to create two separate axes to visualize the data. Alternatively, you might want to create a single axes, and to break it to reflect the different ranges. Michael Robbins's BREAKPLOT makes short work of that task. Consider, for example, that you had some sampled engine-speed data collected during two times in the engine's cycle. The first 100 data points are colleced (at sampling times 1:100) while the engine is idling, and the second 100 data are collected (at t = 101:200) while the engine is being revved:sampleTimes = 1:200; RPM = [600+rand(1,100)*500, 5500+rand(1,100)*2500];
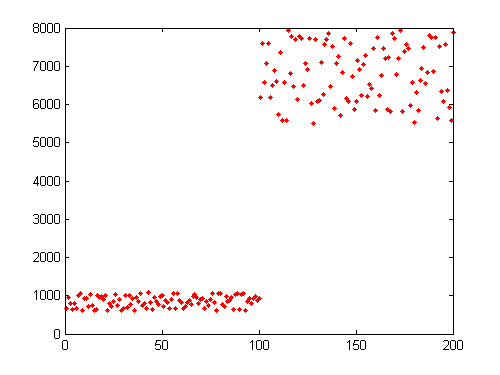
Traditional plot
Note all the wasted "white space" in the traditional plot of these data. Also note how tightly clustered the data can be.plot(sampleTimes,RPM,'r.')
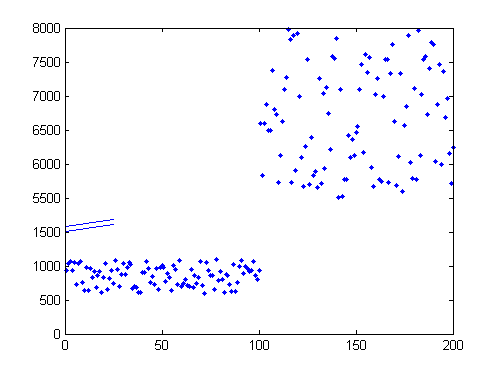
BREAKPLOT
Now consider how Michael's function allows you to break the y-axis to reflect the range change:BreakPlot(sampleTimes,RPM,1500,5000,'Line');
Some things I particularly like about this function
First, this nicely extends the powerful visualization capabilities MATLAB provides out of the box--and the ability to customize functions is often critical. Second, Michael provided nice options for different break visualizations. The default 'RPatch' produces a ragged patch across the axis. 'Line' (shown above) shows hash marks where the axis is broken. And 'Patch' produces a smoother break reaching across the axis. Finally, I appreciate Michael's responsiveness when I asked him to address an issue I saw with an earlier version of his code. This demonstrates yet again that the File Exchange is dynamic and ever-improving! If you have any custom visualizations along these lines, tell us about them in the Comments box below, and share them on the File Exchange! And by the way, next Friday is the day after Thanksgiving. Bob, Jiro and I will be taking the day off to digest our turkey dinners, and we hope you'll be doing the same. Look for our next Pick of the Week on December 5. Happy Thanksgiving, everyone!- Category:
- Picks


See Also
-
Alternative Box Plot
Blogs


Comments
To leave a comment, please click here to sign in to your MathWorks Account or create a new one.