File Exchange Pick of the Week

February 6th, 2009

PlotAxisAtOrigin

Bob's pick this week is PlotAxisAtOrigin by Shanrong Zhang.

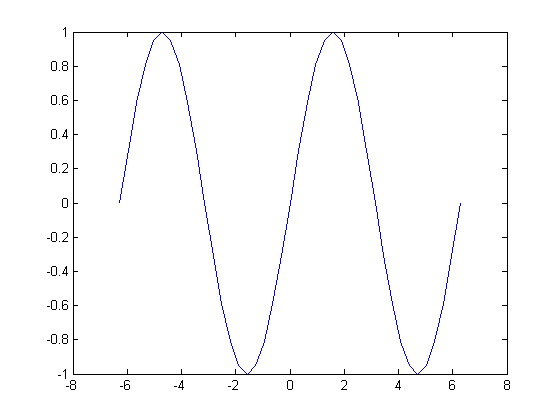
As an application engineer I showed MATLAB to a lot of people. Occasionally when I presented graphics capabilities someone would ask how to make plots where the X and Y axes lines go through the origin. You know: the way we learned to draw them in school. By default MATLAB puts the X axes on bottom and the Y axes on the left.

x = -2*pi:pi/10:2*pi;
y = sin(x);
plot(x,y)

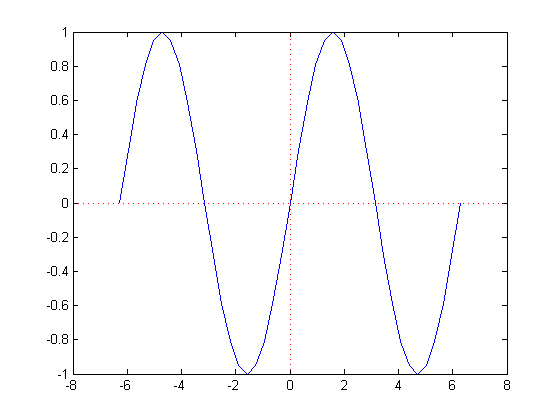
While the xAxisLocation can be set to top, and the yAxisLocation can be right, neither has an origin option for example. So, instead, I usually suggested drawing lines through the origin. In fact, prior "Pick of the Week" star Brandon Kuczenski made that trivial with hline and vline.

hline(0)
vline(0)

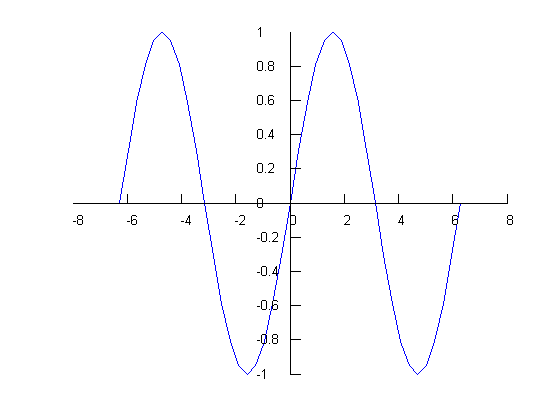
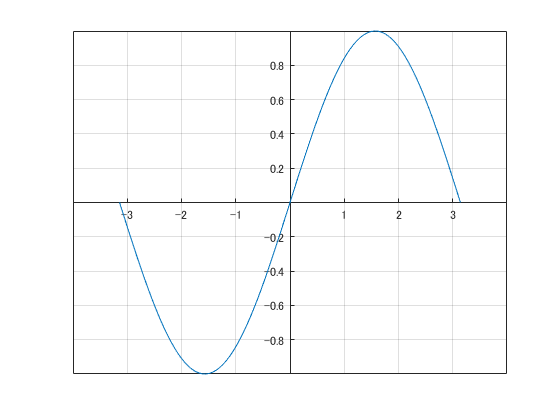
Not satisfied? Neither was Shanrong. Hence, PlotAxisAtOrigin.

PlotAxisAtOrigin(x,y)

Comments?


Get the MATLAB code

Published with MATLAB® 7.8

4 Responses to “PlotAxisAtOrigin”

  1. Markus replied on :

    Sorry, but I think this package is not very useful. On the first view it looks nice, but the axis will not change when zooming in etc.

    Markus

  2. Bob replied on :

    Markus, I agree that the ability to zoom/pan the plot and have its axes ticks adjust automatically would be a nice enhancement. I see more and more submissions where users collaborate to improve and build upon each others’ work. This example seems like a good opportunity to continue that trend. Any takers? :)

  3. matt fig replied on :

    I posted a file which allows more functionality, though it still has limitations.

    http://www.mathworks.com/matlabcentral/fileexchange/22956

  4. Bob replied on :

    Matt, that is an interesting solution. The pan behavior was particularly fun. Thank you very much for the contribution. I added your submission to my watch list. :)

    Solving this problem clearly involves a lot of thinking and deciding about what behaviors to support and how to implement those features. MATLAB users tend to have very different preferences. Meeting everyone’s requirements may not be possible. That may explain why AXES objects currently follow a simple model.

Leave a Reply

Wrap code fragments inside <pre> tags, like this:

<pre class="code">
a = magic(3);
sum(a)
</pre>

If you have a "<" character in your code, either follow it with a space or replace it with "&lt;" (including the semicolon).


Bob, Brett & Jiro share their favorite user-contributed submissions from the File Exchange.

  • Zach: Hi Doug and Les, I didn’t have a lot of time to mess with this, but I did find a work-around. I plotted...
  • hamed: k
  • Les: @Zach This isn’t exactly what you are looking for but at least it puts all three parameters on the same...
  • Zach: Thanks for your suggestions Doug. I’ll give that a shot and see what happens. I’ve seen many of...
  • Doug: @Zach, I would say to use plotYYY, because that is close to what you want, but using depth as Y makes sense....
  • Doug: @Teja, I think this will work: http://www.mathworks .com/access/helpdesk /help/techdoc/ref...
  • Gify: merry christmas :) nice christmas tree! Regards, Janet Gify
  • Teja: Dear Doug Is there anyway to plot a surface from nonuniform data without meshgrid and griddata? Basically i...
  • Zach: I’m working with geophysical data, so I’d like to produce a depth profile. The y-axis would be...
  • Doug: @Ashok First, please do not use variable names that are MATLAB commands (std and mean). Second, p(j) should be...

These postings are the author's and don't necessarily represent the opinions of The MathWorks.