File Exchange Pick of the Week

September 25th, 2009

lasso.m

Bob's pick this week is lasso.m by Thomas Rutten.

Suppose you have a set of XY points. You plot them to see how they spread out. You decide a certain clump of points is special. How do you get MATLAB to know which points you care about? With lasso you can select them with your mouse!

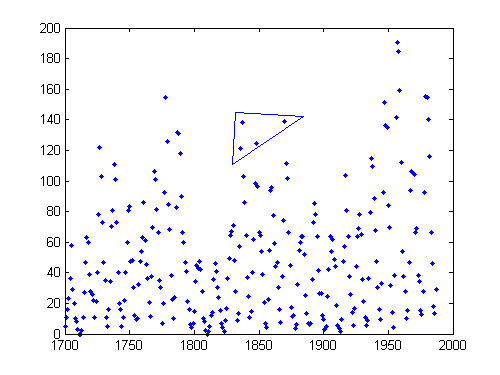
To demonstrate I will use the sunspot example data that ships with MATLAB.

load sunspot.dat
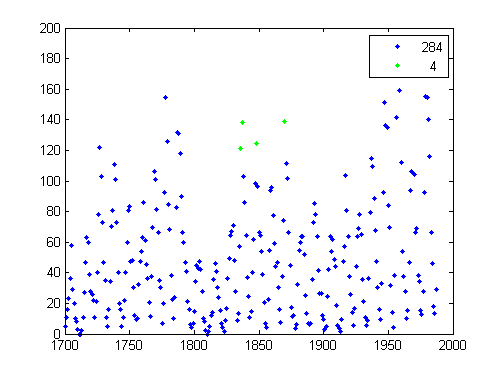
[x,y,i] = lasso(sunspot(:,1),sunspot(:,2))
press a KEY to start selection by mouse, LEFT mouse button for selection, RIGHT button closes loop
x =
        1836
        1837
        1848
        1870
y =
        121.5
        138.3
        124.7
          139
i =
   137
   138
   149
   171
centroid = [mean(x) mean(y)]
centroid =
       1847.8       130.88

The program prompted me how to start and stop the selection. I left off the semicolon to show the values returned for further analysis (ie, centroid calculation). The first plot shows the polygon region I selected. The second plot shows the selected points with a free legend and point counter. Nice!

Note: if you like graphically interacting with your XY points be sure to check out Data Brushing introduced with R2008a.

Comments?


Get the MATLAB code

Published with MATLAB® 7.9

Leave a Reply

Wrap code fragments inside <pre> tags, like this:

<pre class="code">
a = magic(3);
sum(a)
</pre>

If you have a "<" character in your code, either follow it with a space or replace it with "&lt;" (including the semicolon).


Bob, Brett & Jiro share their favorite user-contributed submissions from the File Exchange.

  • Zach: Hi Doug and Les, I didn’t have a lot of time to mess with this, but I did find a work-around. I plotted...
  • hamed: k
  • Les: @Zach This isn’t exactly what you are looking for but at least it puts all three parameters on the same...
  • Zach: Thanks for your suggestions Doug. I’ll give that a shot and see what happens. I’ve seen many of...
  • Doug: @Zach, I would say to use plotYYY, because that is close to what you want, but using depth as Y makes sense....
  • Doug: @Teja, I think this will work: http://www.mathworks .com/access/helpdesk /help/techdoc/ref...
  • Gify: merry christmas :) nice christmas tree! Regards, Janet Gify
  • Teja: Dear Doug Is there anyway to plot a surface from nonuniform data without meshgrid and griddata? Basically i...
  • Zach: I’m working with geophysical data, so I’d like to produce a depth profile. The y-axis would be...
  • Doug: @Ashok First, please do not use variable names that are MATLAB commands (std and mean). Second, p(j) should be...

These postings are the author's and don't necessarily represent the opinions of The MathWorks.