
MathWorks Math Modeling Challenge
This week’s post is by Reece Teramoto.
MathWorks recently took over sponsorship of the Math Modeling Challenge, a contest for high school juniors and seniors in the U.S organized by SIAM – Society for Industrial and Applied Mathematics. https://m3challenge.siam.org. Students work in teams to solve real-world problems that professional mathematicians face. Teams are given 14 hours to complete a three-part problem using math modeling and put together a paper showing their results. Teams can choose to use any software or language (or none) to do their mathematical computations.
The 2018 Competition Problems
We decided to put together a set of sample solutions to this past year’s problem done with MATLAB.
This past year’s challenge focused on the problem of wasted food. Students were challenged to perform computations to analyze the amount of wasted food and apply the results to come up with solutions of feeding the millions of food-insecure individuals in the country. You can view the full problem here and the winning solutions here.
In this post, I’ll be walking through a brief overview of each part of the problem as well as a summary of a sample solution put together in MATLAB. The corresponding live script for each example will demonstrate how to do the following in MATLAB:
- Import data
- Process and model data
- Visualize the results (charts, graphs, curve fitting, plots)
- Make meaningful conclusions from the results
While all three parts of the problem demonstrate the steps above, the three parts will each focus on a different tool in MATLAB. We will focus on the Import Tool, Curve Fitting app, and Mapping Toolbox.
Before reading through the rest of this post, please download the full MATLAB examples from File Exchange so that you may refer to them.
Contents
- Just Eat It! (Import Tool)
- Food Foolish? (Curve Fitting app)
- Hunger Game Plan? (Mapping Toolbox)
- Want to participate in the challenge?
Just Eat It! (Import Tool)
You can find the full example for this problem by opening the file Just_Eat_It.mlx from the archive linked to at the beginning of this blog post.
For this part of the problem, students are to create a mathematical model that a state could use to determine if it could feed its food-insecure population using the wasted food generated in that state. Students are provided with sample data for food waste and insecurity in the state of Texas.
This is one way to approach this problem, employing technical computing skills:
- Calculate how many dollars of food the state consumers waste.
- Calculate how many dollars are needed to feed all the food-insecure individuals in the state.
- Compare the two values to determine how much of the state’s food-insecure population can be fed by using the wasted food of the state’s consumers.
First, we can use the MATLAB Import Tool to import the provided spreadsheet data and save everything to tables. This import can be performed with a few clicks:


Once we have our data in MATLAB, we can use many built-in MATLAB functions to organize and summarize our data.
From the data, we can calculate the dollar value of wasted food in Texas for different categories, which we can visualize:
bar(foodWasteTable.TypeofFood, foodWasteTable.WastedDollars);
ytickformat('usd')
xlabel('Type of Food')
ylabel('Amount Wasted')
title('Dollars of Wasted Food in Texas (2016)')

% change the y-axis to be in the form of n x 10^6 (millions)
ax = gca;
ax.YAxis.Exponent = 6;

% sort from smallest to largest food waste
foodWasteTable = sortrows(foodWasteTable,'WastedDollars');
% combine the 3 smallest categories and label them as "other"
p = pie([sum(foodWasteTable.WastedDollars(1:3)); foodWasteTable.WastedDollars(4:end)]);
legend(["other"; foodWasteTable.TypeofFood(4:end)], 'Location', 'eastoutside')
title('Categories of Wasted Food')

As one might expect, the two largest types of wasted food are meat and produce. After further calculations, we find that the value of wasted food in Texas is about $2.3 billion annually.
The second step is finding the dollars are needed to feed all the food-insecure individuals. Feeding America performs this calculation here. We can easily translate this into MATLAB to find that the annual cost to feed food insecure individuals in Texas is about $2.2 billion.
For the final comparison, and based on our assumptions noted in the file Just_Eat_It.mlx, we determined that we can feed all the food-insecure individuals in Texas that by repurposing wasted food in the state.
Food Foolish? (Curve Fitting app)
You can find the full example for this problem by opening the file Food_Foolish.mlx from the archive linked to at the beginning of this blog post.
Personal choices when it comes to food consumption primarily occur at the grocery store, school cafeteria, restaurants, and at home. For this part of the problem, students are to create a mathematical model that can be used to determine the amount of food waste a household generates in a year based on their traits and habits. The model should then be applied to the following households:
- Single parent with a toddler, annual income of $20,500
- Family of four (two parents, two teenage children), annual income of $135,000
- Elderly couple, living on retirement, annual income of $55,000
- Single 23-year-old, annual income of $45,000
We will use the Curve Fitting App in MATLAB to find the relationship between household income and wasted food. Our approach is as follows:
- Gather data for household incomes and wasted food. We can think of each data point as a point on an XY-plane, where the X-axis is household income and the Y-axis is wasted food.
- Use the Curve Fitting App to generate a function that models the trend.
- Visualize this relationship.
- Evaluate the curve at the income levels of the sample family data.
The U.S. Bureau of Labor Statistics has collected data on annual food expenditures for individuals of varying income. You can find the data in this spreadsheet. We can import this data into MATLAB using the Import Tool and store the data in a table.
Once we have the data points, we can use the Curve Fitting App to generate the curve fit. The app makes it easy to quickly try out different fits of a curve to the data points and see the immediate result of each fit:

Once we have our fitted curve, we can pass in the sample family income data:
sampleIncome = [20500 135000 55000 45000]';
sampleWaste = foodWasteCurve(sampleIncome);
families = {'Single parent with a toddler', 'Family of four (two parents, two teenage children)', ...
            'Elderly couple, living on retirement','Single 23-year-old'};
solution = table(sampleIncome,sampleWaste, 'RowNames', families)

We can also plot both a bar graph and line graph of the trend of food waste for various incomes. Then, we can plot points for the 4 sample families given in the problem statement. This graph makes it easy to visualize the relationship between household income and annual dollars of wasted food. Since we assumed that food waste depends only on household income, we have a solution for this part of the problem.
% bar graph
bar(incomeRange, wasteDemo)
hold on

% line graph
plot(incomeRange, wasteDemo, 'LineWidth', 3, 'Color', 'green')

% plot points of the 4 families from the problem statement
scatter(solution.sampleIncome, solution.sampleWaste, 'Marker', '*', 'LineWidth', 5, 'MarkerEdgeColor', 'red')

hold off
xlabel('Income (USD)')
ylabel('Annual Food Waste (USD)')
title ('Food Waste by Income')

Hunger Game Plan? (Mapping Toolbox)
You can find the full example for this problem by opening the file Hunger_Game_Plan.mlx from the archive linked to at the File Exchange <link>.
For this problem, students were to use mathematical modeling to provide insight on a strategy that a local community could use to repurpose wasted food with minimal cost.
Our approach was as follows:
- Use Mapping Toolbox to display location of two dozen grocery stores, including all the Stop and Shops, in Boston.
- Display the location of The Greater Boston Food Bank.
- Find the shortest path that starts at the food bank, visits all the grocery stores to collect otherwise-wasted produce from the past week, and ends at the food bank.
- Calculate the trucking costs and dollars of saved produce from the past week.
Since Stop and Shop is the most popular grocery store chain in New England and The Greater Boston Food Bank is an organization that MathWorks supports, our approach for this problem was to find the shortest path that a food collection truck could start at The Greater Boston Food Bank, visit each Stop and Shop and a few other stores in the Boston area to collect otherwise-wasted produce, and return to The Greater Boston Food Bank. We want the shortest path since this would minimize the cost of operating the truck.
This particular scenario is known in computer science as the Travelling Salesman Problem (TSP), in which a salesman starts from their home city and wants to visit multiple cities and return home in the shortest possible path.
Mapping Toolbox lets us plot points on a map given their latitude and longitude values. We start by displaying all the Stop and Shop locations in the Boston area (identified by a green marker). The coordinates were obtained from Google Maps.
This TSP with only 13 locations is not much of a challenge, so we add 11 more locations (shown in dark red) chosen at random, as well as The Greater Boston Food Bank (indicated in blue).
wmmarker(Lats(1:13), Lons(1:13), 'Icon', 'stopandshoplogo.jpg')
wmmarker(Lats(14:24), Lons(14:24), 'color', darkred)
wmmarker(Lats(25), Lons(25), 'color', ‘blue’)

The previous Cleve’s Corner post described a near-optimal solution of the Travelling Salesman Problem.. We can pass in the coordinates to traveler to obtain the shortest path between them. We can view this path using the Mapping Toolbox as well:
Lats = Lats(path);
Lons = Lons(path);
wmline(Lats, Lons)
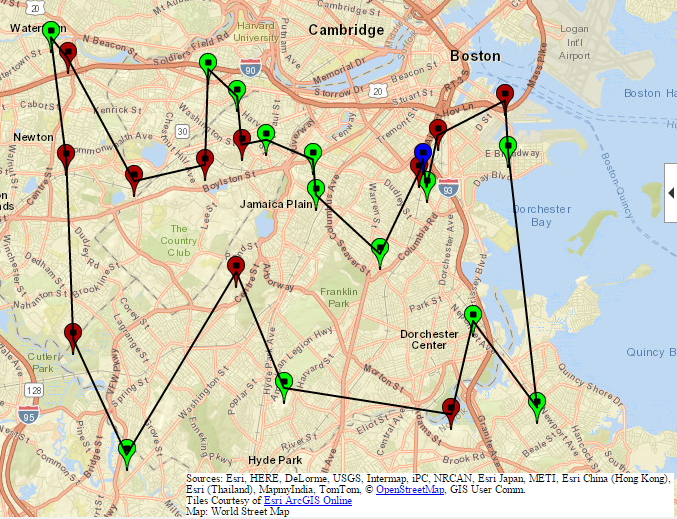
Although the path returned does not consider the exact path of the roads, we still get a good estimation of the shortest path and the distance traveled. The expense of operating an 18-wheeler is a little over \$1 per mile, we can calculate the total cost of gas for this trip—around \$30.
Additionally, we can use some data from the National Resources Defense Council to calculate that the average grocery store in the U.S. wastes about \$7500 per week in fruits and vegetables. This means that by completing this round trip, we will salvage almost \$200,000 worth of otherwise-wasted fruits and vegetables from just these locations in the Boston area from the past week. Pretty good!
Want to participate in the challenge?
Hopefully this has given you a glimpse at how easy MATLAB makes it to analyze, visualize, and perform computations on data. To view the full MATLAB solutions for the above problems, please download the files from File Exchange.
Additionally, if you know of any high school juniors and seniors who would be interested in the challenge, encourage them to participate! The challenge is free to enter and there are $100,000 in scholarships at stake. The challenge is done completely online and there are plenty of reference materials to help teams prepare. For more information, please visit the following link:
- Category:
- Algorithms,
- Fun


Comments
To leave a comment, please click here to sign in to your MathWorks Account or create a new one.