
Graphical Display Techniques – Part 1
I've recently been working with some customers who need to display extra information on top of a plot. Steve showed some examples for superimposing lines on images in such a way so they are visible despite what's going on in the picture. Today I'll show you a few such techniques here.
Contents
Making Lines Visible
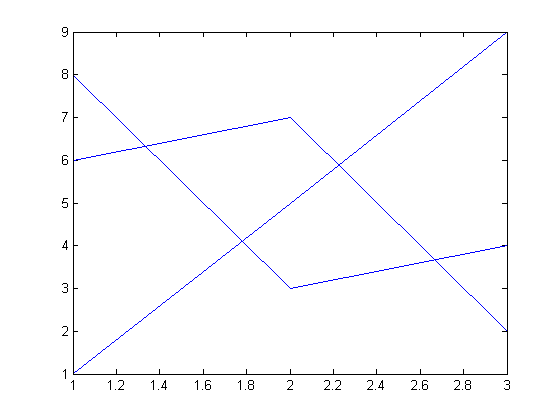
I'll start with two techniques for making sure lines show up on a background of other information. These are
- two lines, with different color and linewidth
- two lines, with different linestyle
First let's see what happens with a single line.
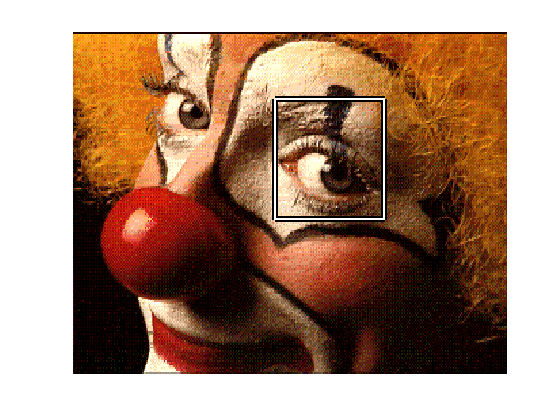
load clown
image(X),colormap(map)
axis off
hold on
rect  = [ 150 40 80 70]
h = rectangle('position',rect);
rect =
   150    40    80    70

It's kind of hard to see this black edge of the rectangle outlining the eye on the right. Let me make it more visible by thickening it, and placing a thinner line inside.
set(h,'LineWidth',5)
h2 = rectangle('position',rect);
set(h2,'EdgeColor','w','LineWidth',2)
Let me adjust the linestyle instead of the width.
set(h,'LineWidth',2,'LineStyle','-')
set(h2,'LineStyle',':')

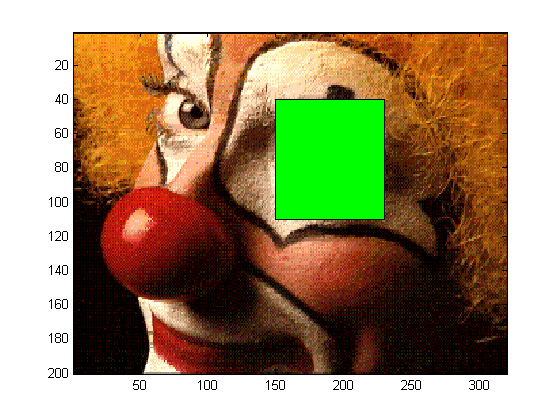
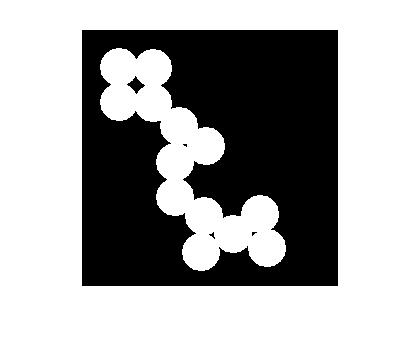
Making Markers Visible
Similarly, you can ensure that markers are visible on your plots by exploiting the separable colors for the face and edge.
delete([h h2])
hm = plot(60,125,'s')
set(hm,'MarkerSize',10,'MarkerEdgeColor','w','MarkerFaceColor','m')
hold off
hm =
          177

What Techniques Do You Use?
Do you have some other graphical techniques to ensure all the elements are clearly visible? Let me know here.
- Category:
- Graphics


Comments
To leave a comment, please click here to sign in to your MathWorks Account or create a new one.