
Direct Access to Seismological Data using MATLAB
I've recently been engaged in several events of potential interest to the geophysics community. In December 2014, a few of us from MathWorks attended the AGU meeting (American Geophysical Union).
And last week, I was invited to give a webinar to the IRIS (Incorporated Research Institutions for Seismology) community. The video for MATLAB for Analyzing & Visualizing Geospatial Data is here.
Next, I would like to pass on some timely information from Chad Trabant and Robert Weekly, from IRIS, about accessing seismological data via IRIS sites and services.
Contents
Introduction
Traditionally, seismologists spend considerable time and effort collecting and organizing the data they wish to use for a study. In an effort to reduce this prep work, the IRIS Data Management Center (DMC) are constantly trying to remove barriers associated with data collection and formatting to deliver data to users that is easy for them to use and will give researchers more time to actually perform their research.
The DMC operates one of the largest repositories of openly available seismological time series data. Data managed by the DMC is retrieved from stations around the world, with international partners contributing data, in addition to data collected by U.S. institutions. These data are primarily from passive source sensors and are what most folks are familiar with when they see earthquake signals.
One of the primary charges of the DMC is to collect, archive, and distribute data to not only university researchers and teachers, but to anyone with internet access. A significant amount of work at the DMC is dedicated to building software packages that enable people to access the data stored in the DMC archives through a variety of web-enabled clients.
Accessing data from the DMC in MATLAB
For MATLAB users, DMC has developed irisFetch.m which provides seamless access to data stored at the DMC, as well as other data centers that implement standard web services.
This bit of MATLAB code operates as an abstraction layer to the DMC IRIS-WS Java library, which in turn fetches data and information from a data center via web services. Importantly, a user does not need to know anything about Java or networking: syntax for the functions provided by irisFetch.m should be familiar to users of the MATLAB language, and all data is returned as MATLAB structures.
The irisFetch module provides access to the following:
- Time series data, mostly seismological (ground motion)
- Seismological station metadata, including instrument response
- Event (earthquake) parameters, e.g., location, time, magnitude
Help getting started using irisFetch.m is available in the online manual for irisFetch. Examples are also included below.
A standard web services foundation, accessing data at multiple centers
The core web services for delivering time series, related metadata and event (earthquake) information used by irisFetch have been standardized by the FDSN2. DMC has purposely designed irisFetch, and the Java library it uses, to work with any services compliant with the specification. This means that irisFetch may be used to retrieve data from any data center supporting these services, however, not all data centers have implemented every FDSN-standardized service, so functionality with irisFetch is limited to what any given center supports. A list of FDSN data centers and the services they support is here.
A short aside on seismic data nomenclature and norms
In the world of passive source seismology (SEED format specifically) time series are identified with four identifiers: network, station, location and channel. Most of the data available from the DMC is recorded continuously, sometimes for decades, so a time range must also be specified to form a minimal request. In the irisFetch functions, time series are selected using these identifiers. In most cases, seismological data is returned in units of "digital counts", which is often proportional to velocity or acceleration within a certain frequency range.
Examples
The irisFetch module comprises three separate methods that can used to retrieve station metadata, time series, and event information. They are irisFetch.Stations, irisFetch.Traces and irisFetch.Events, respectively. Below are some examples of how each of these components of irisFetch could be used for common data retrieval tasks.
Example 1
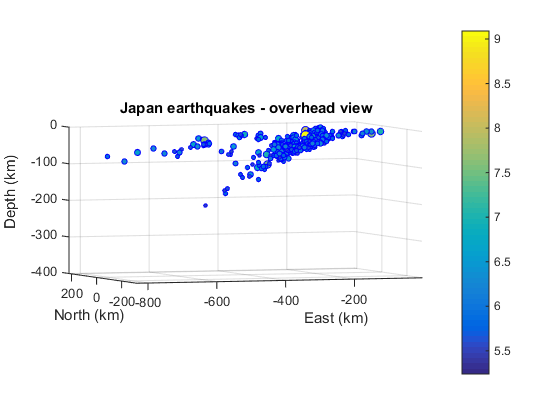
Plot time series for the 2011 Tohoku-Oki earthquake. The example below uses irisFetch.Traces to retrieve time series data for global GSN stations to plot 1 hour of data (bandpass filtered from 1 - 5 Hz) following the Tohoku-Oni earthquake of March 2011.
  sta = {'MAJO','WMQ','KAPI','CMB'};
  for i=1:length(sta)
      tohoku_tr(i) = irisFetch.Traces('_GSN',sta{i},'00','BHZ','2011-03-11 15:10:00',...
          '2011-03-11 16:10:00','verbose');
  end
set filter parameters
  bandfilt_freq1 = 1;
  bandfilt_freq2 = 5;
  bandfilt_order = 4;
  colors = brighten(lines(numel(tohoku_tr)),-0.33);
  figure(1)
  for i=1:numel(tohoku_tr)
      subplot(4,1,i)
      tr = tohoku_tr(i);
      data = (tr.data - mean(tr.data)) ./ tr.sensitivity;
      wn1 = bandfilt_freq1/tr.sampleRate;
      wn2 = bandfilt_freq2/tr.sampleRate;
      [f1,f2] = butter(bandfilt_order,[wn1 wn2],'stop');
      data = filter(f1,f2,data);
      sampletimes = linspace(tr.startTime,tr.endTime,tr.sampleCount);
      plot(sampletimes, data, 'color', colors(2,:),'LineWidth',1);
      datetick;
      if i==1
          title('Tohoku-Oni Earthquake, 11-March-2011','FontSize',14)
      end
      if i~=numel(tohoku_tr)
          set(gca,'xticklabel','');
      else
          xt = get(gca,'XTick'); xtl = get(gca,'XTickLabel');
          xt = xt(1:2:end); xtl = xtl(1:2:end,:);
          set(gca,'XTick',xt,'XTickLabel',xtl);
      end
      set(gca,'YTick',[],'YTickLabel','','TickDir','out',...
          'TickLength',[.005 .015],'FontSize',12);
      ylabel([tohoku_tr(i).network '.' tohoku_tr(i).station])
      hold on;
  end
Example 2
Plot a map of Transportable Array (TA) network stations and recent earthquakes in Oklahoma. This example uses irisFetch.Events and irisFetch.Stations to retrieve hypocenter data and station metadata, respectively, to make a simple plot in MATLAB.
  minlat = 35; maxlat = 37.5;
  minlon = -100; maxlon = -95;
  starttime = '2012-01-01 00:00:00';
  endtime = '2015-02-01 00:00:00';
  maxmag = 4.0; minmag = 0.0;
  ok_ev =
  irisFetch.Events('boxcoordinates',[minlat,maxlat,minlon,maxlon],...
      'maximumMagnitude',maxmag,'minimumMagnitude',minmag,...
      'startTime',starttime,'endTime',endtime,...
      'baseurl','http://service.iris.edu/fdsnws/event/1/');
ok_sta = irisFetch.Stations('station','TA','*','*','BH?',...
'boxcoordinates',[minlat,maxlat,minlon,maxlon]); figure(2)
plot([ok_ev.PreferredLongitude],[ok_ev.PreferredLatitude],'r.',...
'MarkerSize',10)
hold on
plot([ok_sta.Longitude],[ok_sta.Latitude],'b^','MarkerFaceColor','b')
deg2in=6.0/diff(xlim);
set(gca,'units','inches','pos',...
[1.5 1 diff(xlim)*cosd(35)*deg2in diff(ylim)*deg2in],...
'FontSize',12,'TickDir','out')
l = legend('Earthquake','TA station','Location','NorthEast');
set(l,'FontSize',12)
xlabel('Longitude')
ylabel('Latitude')
title(['M<' num2str(maxmag) ' -- ' datestr(starttime(1:10),1) ' to ' ...
datestr(endtime(1:10),1) ' -- ' ...
num2str(numel(ok_ev)) ' total events'],'FontSize',14)
Example 3
Retrieving data from other datacenters. The versatility of the irisFetch methods allow users to access data from web services hosted by other datacenters, as long as they conform to the specification set by the FDSN (as discussed above). This example uses data obtained from the USGS fdsn-event service and some simple commands from the MATLAB Mapping Toolbox.
  minmag_glob = 6;
  tstart = '2000-01-01 00:00:00';
  glob_ev = irisFetch.Events('startTime',tstart,'minimumMagnitude',minmag_glob,...
      'baseurl','http://earthquake.usgs.gov/fdsnws/event/1/');
figure(3)
% Here we use the MATLAB Mapping Toolbox
h = worldmap('world');
geoshow(h,'landareas.shp','FaceColor',[.3 .3 .3])
l = geoshow(h,[glob_ev.PreferredLatitude],[glob_ev.PreferredLongitude],'DisplayType','point');
set(l,'Marker','.')
mlabel('GLineWidth',.2,'FontSize',12,...
'MLabelLocation',90,'MLabelParallel','south');
title(['Global M>' num2str(minmag_glob) ' events since ' datestr(tstart(1:10),1)],...
'FontSize',14)
Trouble accessing your seismological data?
How do you get access to the seismological data you analyze – irisFetch – or something else? What are the stumbling blocks you encounter when accessing or working with seismological data? Let us know here.
Footnotes
- The "Incorporated Research Institutions for Seismology (IRIS)" is a consortium of universities that, among other activities, operate shared facilities to support research and education about seismology. IRIS is supported by the "National Science Foundation" most recently under award "EAR-1261681".
- Among other functions, the "International Federation of Digital Seismograph Networks (FDSN)" maintains specifications for services and formats for seismological data.


Comments
To leave a comment, please click here to sign in to your MathWorks Account or create a new one.