
Is This a Sine Wave?
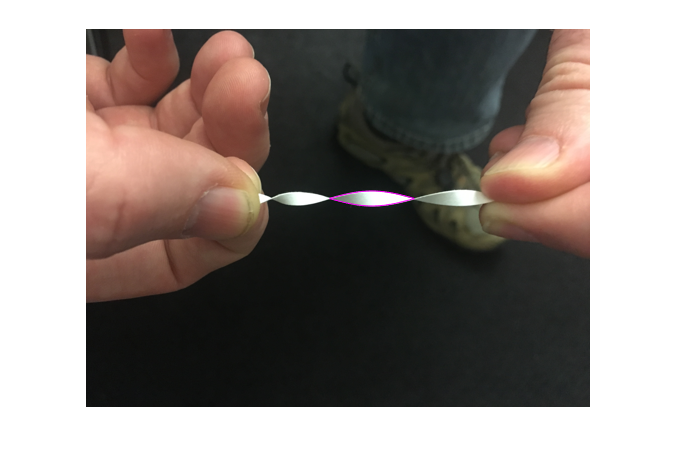
I was talking with Mike, my boss, one afternoon. And we had been fiddling with some paper as we spoke. After trimming a page, we ended up with a not skinny strip of stiff paper. As Mike twisted it, we wondered if the envelope we could see was a sine wave.
Get the Data into MATLAB
First thing, take picture to load into MATLAB.
imshow sinWave.png

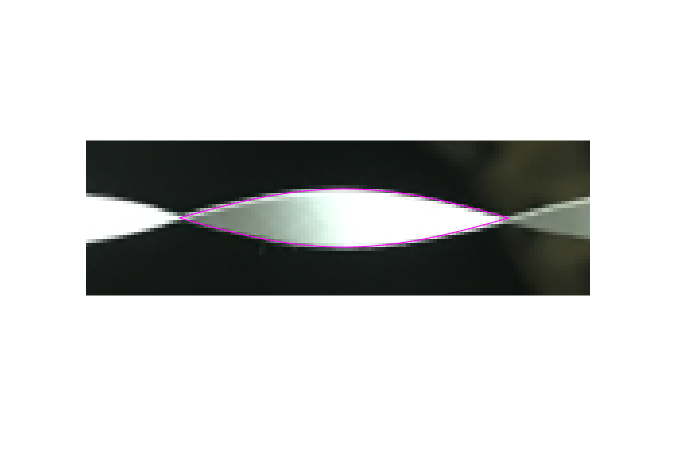
Next do an eyeball experiment. I select a section of the twisted paper. And overlay a sine wave, with guessed amplitude.
hold on
axis on
x = [244 329];
y = [170 170];
del = diff(x);
nsteps = 100;
xx = x(1):del/nsteps:x(2);
lenxm1 = length(xx)-1;
scale = 4.0;
yy1 = y(1)+scale*sin((0:lenxm1)/lenxm1*pi);
yy2 = y(1)-scale*sin((0:lenxm1)/lenxm1*pi);
plot(xx,yy1,'m',xx,yy2,'m')
hold off
axis off

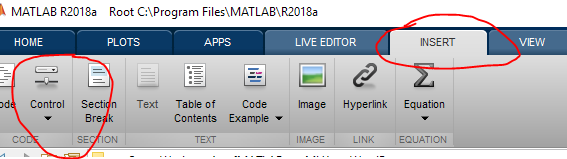
Problem is, I don't know what the scale factor should be. I can try some values out. By changing the code and re-running the section. OR I can take advantage of one of the new features available in Live Scripts, a Numerical Slider control. I can find this in the Insert Gallery of the MATLAB Toolstrip.
So let's start again and see what this would look like.
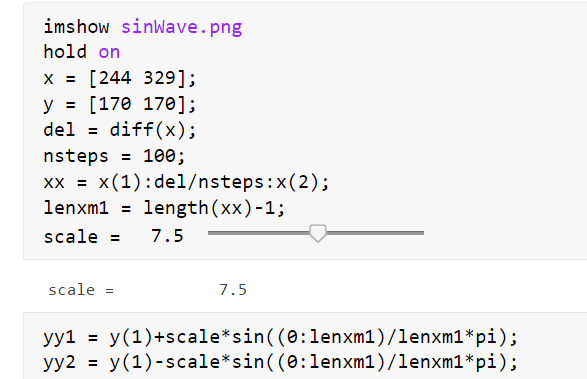
imshow sinWave.png
hold on
x = [244 329];
y = [170 170];
del = diff(x);
nsteps = 100;
xx = x(1):del/nsteps:x(2);
lenxm1 = length(xx)-1;
scale = 7.5
scale =
          7.5
yy1 = y(1)+scale*sin((0:lenxm1)/lenxm1*pi);
yy2 = y(1)-scale*sin((0:lenxm1)/lenxm1*pi);
plot(xx,yy1,'m',xx,yy2,'m')
hold off
When you try the interactive controls in the Live Editor, you will see that the section reruns after the control is updated. A nice way to explore the consequences of specific parameter choices for your work!
Next let's see a zoomed in view.
axis([220, 350, 150 190])
Of course we could zoom interactively but since I don't feel like creating a video, I am doing it programmaticaIly instead. You can use the interactive zoom tools for plots in the Live Editor if you prefer.
My exploration by plotting doesn't prove anything, but I do think it's suggestive that a sine wave is at least a good candidate for the envelope of the twisted strip.
By the way, this is a picture of the Live Editor code with the slider in it.
Have You Been Using the Live Editor, and its Newest Additions?
I have found that the interactive tools in the Live Editor make parts of my exploratory work much more efficient and satisfying. What have you been able to do more easily with the Live Editor? Let me know here.


Comments
To leave a comment, please click here to sign in to your MathWorks Account or create a new one.