
Introducing the TopoToolbox
My guest blogger today is Sebastian Gross. He is an engineer in our academia team in Munich, Germany, and works with our university customers to make them successful in research and teaching. In today’s post he introduces TopoToolbox[1,2].
Contents
Overview
Thank you, Loren, for giving me this opportunity to write about TopoToolbox. This collection of functions offers quantitative methods for the analysis of relief and flow pathways in digital elevation models while not using a GIS environment. One application is to learn about flooding risks in a particular geographical area.
The idea to write a blog post about it came to me when reading news such as ‘Flooding has slammed every Iowa county since 1988, some as many as 17 times’[3]. These make you think. Even closer for me, severe floodings were reported in six German federal states and seven other countries in 2013[4].
Most of us have seen some degree of flooding happen - a street submerged in water, a flooded field, or a river that has left its usual boundaries. Just this year on a private vacation trip my wife and I encountered a bridge which had collapsed due to a river’s force and we had to continue our approach to an archeological site on foot. Research suggests that the risk is increasing because of climate change[5]. So, I was tempted to take a closer look at flooding.
A while back during the European Geoscience Union General Assembly (EGU) in Vienna, Austria, in April 2018, I met Wolfgang Schwanghart who is a geomorphologist at the University of Potsdam in Germany. Wolfgang is one of the authors of TopoToolbox. I had previously met the second author Dirk Scherler as well. Dirk works at the German Research Center for Geosciences (GFZ) in Potsdam and one of his research fields is geomorphology.
TopoToolbox is available via File Exchange[6] as zip-File or from the project’s website[1] in several formats including a toolbox file (.mltbx) for simple installation and management. The toolbox comes with an introduction document in Live Script format, which let’s you easily move along the code sections, read the rich comments, and view the results inline.
Importing data
You can import topological data from opentopography.org with the command:
DEM = readopentopo();
-------------------------------------
readopentopo process:
DEM type: SRTMGL3
API url: http://opentopo.sdsc.edu/otr/getdem
Local file name: C:\Users\loren\AppData\Local\Temp\tp6995bbab_ef43_46a2_bac9_b701b896fb61.tif
Area: 2.4e+03 sqkm
-------------------------------------
Starting download: 21-Sep-2018 11:27:03
Download finished: 21-Sep-2018 11:27:13
Reading DEM: 21-Sep-2018 11:27:13

GRIDobj cannot derive a map projection structure. This is either
because the grid is in a geographic coordinate system or because
geotiff2mstruct cannot identify the projected coordinate system used.
TopoToolbox assumes that horizontal and vertical units of DEMs are
the same. It is recommended to use a projected coordinate system,
preferably UTM WGS84. Use the function GRIDobj/reproject2utm
to reproject your grid.

DEM read: 21-Sep-2018 11:27:14
Temporary file deleted
Done: 21-Sep-2018 11:27:14
-------------------------------------
The process also returns a warning with additional information. We will run the suggested reprojection later.
However, the returned data is from the area in Fresno, California, if you do not specify anything else. By chance, I passed the area a few years back, but I used data from the Bavarian Danube river area highlighted in the article[4].
Loading Bavarian data set
The dataset of southern Bavaria can be loaded with
load('bavaria_dem.mat');
Reprojection
To prepare our data for use with TopoToolbox, I follow the warning message's advice and run reproject2utm .
DEM = reproject2utm(DEM,90);
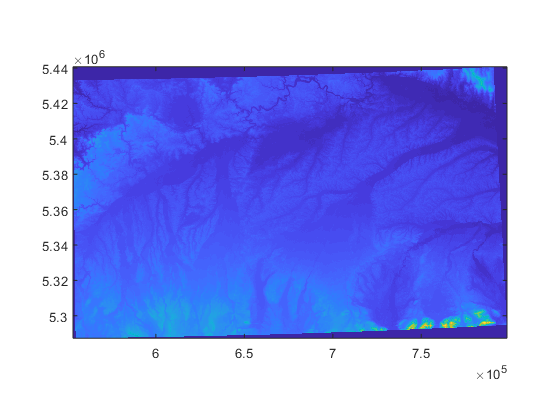
Display data with and without hillshading
The results so far can be displayed with a simple command imagesc .
imagesc(DEM);
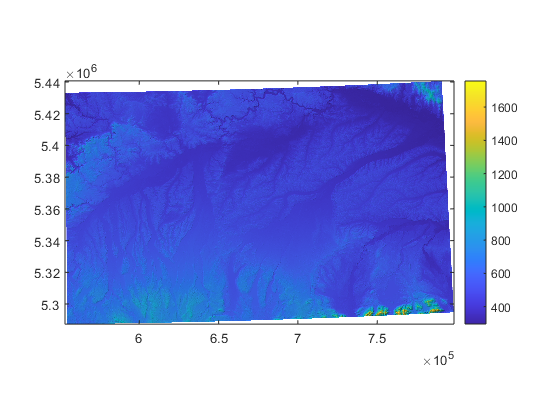
However, we can achieve better highlighting of ridges, slopes, and mountains (hillshading) with imageschs
imageschs(DEM);
Optional sink filling
Now, back to the original idea of looking at water pathways. Using the fillsinks command,
DEMf = fillsinks(DEM);


% holes in the map are filled automatically.
Calculate stream object
With the prepared elevation model, we can calculate the flow direction which is stored in a FLOWobj . These flow directions are the basis for deriving river networks stored in another object, the STREAMobj.
FD = FLOWobj(DEMf);
S = STREAMobj(FD,'minarea',1000);
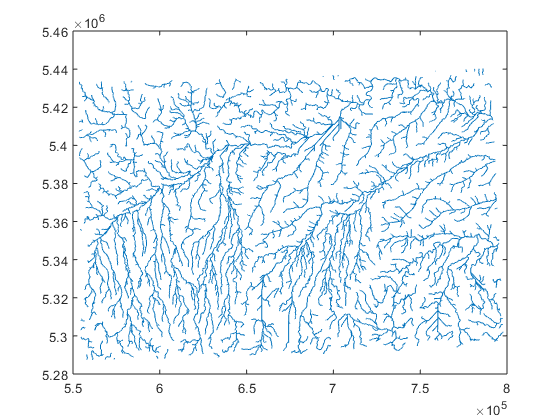
Display water streams
We can display the network with the plot command.
plot(S);
Calculate water accumulation
Finally, the water accumulation in our network can be calculated using the FLOWobj .
A = flowacc(FD);
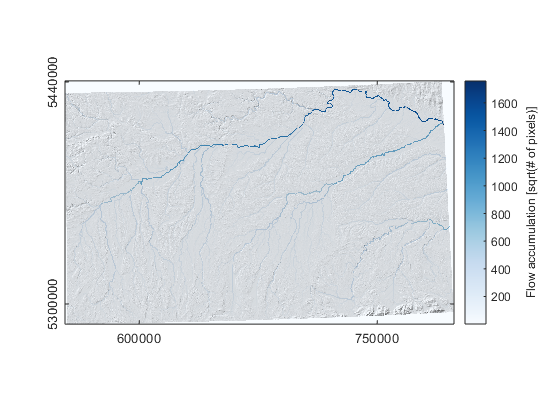
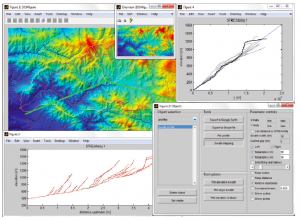
Display flow accumulation
And the resulting water accimulation can be displayed with in a graph easily.
imageschs(DEM,dilate(sqrt(A),ones(5)),'colormap',flowcolor, ...
    'colorbarylabel','Flow accumulation [sqrt(# of pixels)]', ...
    'ticklabel','nice');
Next steps
So, why don’t you head over and try the area where you live? The command readopentopo can be used with the interactive switch readopentopo('interactive',true) to let you choose your area of interest freely.
You get a map window
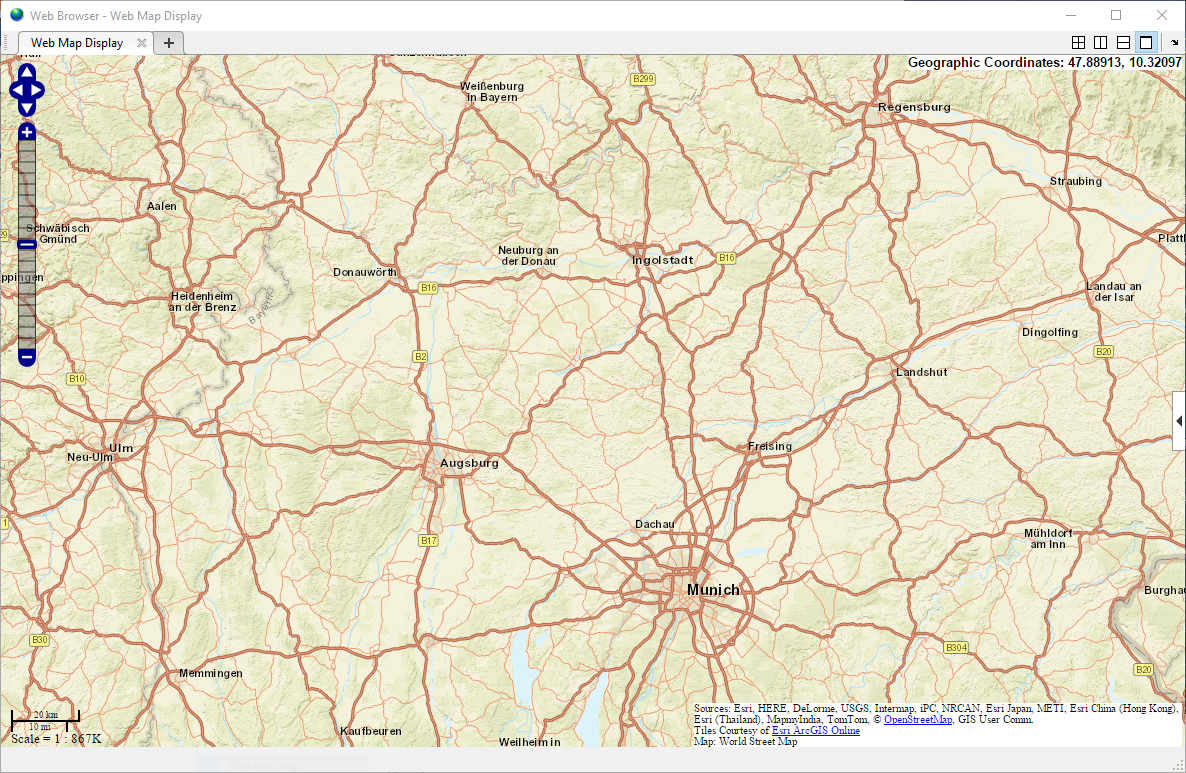
and can select your favorite area
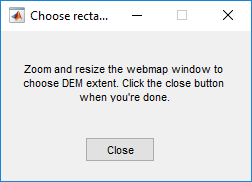
When you finish selecting the area in the map window of the interactive mode, you can confirm it by clicking a button. It works like a charm.
Let us know how this went for you here !
References
[1] TopoToolbox – MATLAB-based software for topographic analysis (website, accessed: July 18th, 2018)
[4] 2013 European floods, Wikipedia, (article, accessed: July 18th, 2018)
- 범주:
- Geosciences


댓글
댓글을 남기려면 링크 를 클릭하여 MathWorks 계정에 로그인하거나 계정을 새로 만드십시오.