
Stateflow Charts Come to MATLAB!
I have been a little bit slow in announcing some of the coolest new features/products in the most recent release, R2019a. Why should you even care? What does Stateflow do? It allows you show the logic behind the work you are doing. You may say "I can already do that in MATLAB with if/else statements, switch/case statements, etc. And you can. But as you add extra conditions, the nesting of code and at least my ability to fully comprehend it can create a lot of mental overhead and burden. With state charts, you can encapsulate extra condition behavior without quite some much clutter, and yet high clarity.
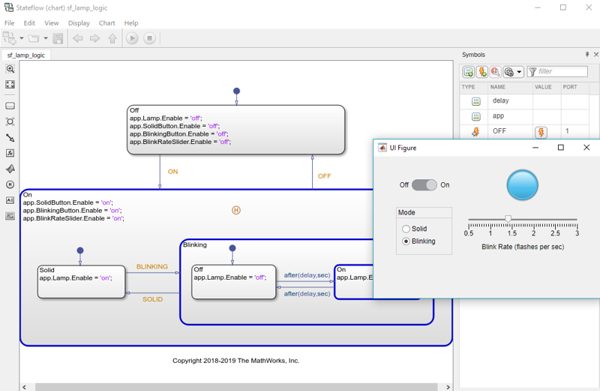
You can get a quick idea from this picture, showing how to design the system of a lamp with the option to have the light blinking at different rates.
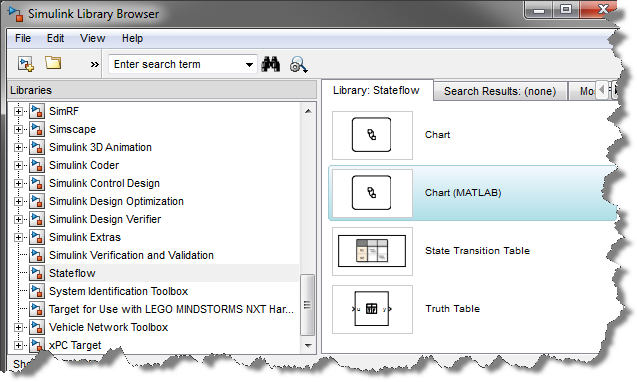
Guy beat me to the punch announcing Stateflow charts for MATLAB. Rather than replicate his wonderful post, I do want to encourage you to read about it. I also encourage you to watch a small video which, I hope, will give you some ideas.
One of the main MATLAB applications we see state charts helping with include the logic that controls Apps. I am quite sure there are others? Do have see a place in your workflow that a state chart can help with? Let me know here.
- Category:
- App Building,
- New Feature


See Also
-
Simulink-to-Stateflow
Blogs
-
-
-

Comments
To leave a comment, please click here to sign in to your MathWorks Account or create a new one.