Fixing PostScript Lines
Jiro's pick this week is fix_lines by Oliver Woodford.
Have you ever generated PostScript files (such as EPS files) from your MATLAB graphs? I had to do that numerous times when I was in grad school and creating graphics for my publications. You can do extensive customization of your plot using basic plotting commands or handle graphics. I also wrote a guest blog post, "Making Pretty Graphs", on Loren's Blog.
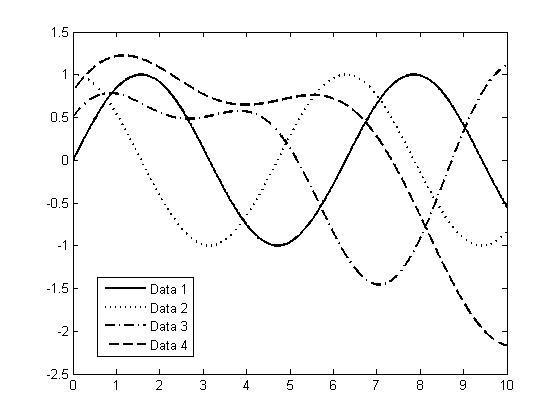
Oliver's fix_lines comes into play at the final step. Let's say that we have the following graph. A lot of journal publications only accept black and white graphics. In that case, we have to make use of different line styles and thicknesses, instead of color.
x = 0:0.01:10;
y1 = sin(x);
y2 = cos(x);
y3 = sin(0.7*x) + 0.5*cos(1.3*x);
y4 = 1.5*sin(0.5*x) + 0.8*cos(0.9*x);
h = plot(x, y1, 'k-', x, y2, 'k:', x, y3, 'k-.', x, y4, 'k--');
set(h, 'LineWidth', 1.5);
legend('Data 1', 'Data 2', 'Data 3', 'Data 4', 'Location', 'Best');

We can create an EPS file.
print -deps2 -r600 fig1.eps
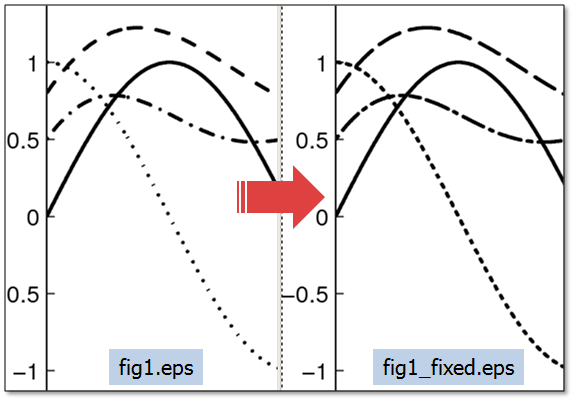
As we can seen below (left), the dotted and dash-dot lines need a little bit of tweaking. One way is to edit the EPS file using an external software. Or, you can use fix_lines.
fix_lines('fig1.eps', 'fig1_fixed.eps');
Notice that the lines look better after it's been "fixed" (right).

I love this because it allows me to do everything in MATLAB, from analysis to the final graph. Oliver's code is very well commented, so it's easy to follow what he's doing. Let us know what you think here.
- Category:
- Picks


Comments
To leave a comment, please click here to sign in to your MathWorks Account or create a new one.