Box plot + Scatter plot
Jiro's pick this week is notBoxPlot by Rob Campbell.
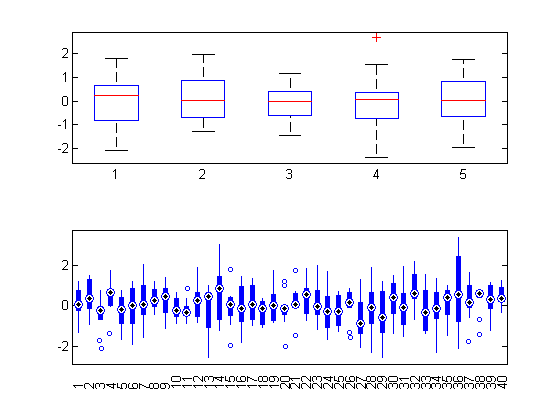
If you have ever used boxplot from the Statistics Toolbox, you know the value of being able to visualize statistical information on a plot.
pts1 = randn(20, 5);
pts2 = randn(10, 40);

figure;
subplot(2, 1, 1);
boxplot(pts1);
subplot(2, 1, 2);
boxplot(pts2, 'plotstyle', 'compact');

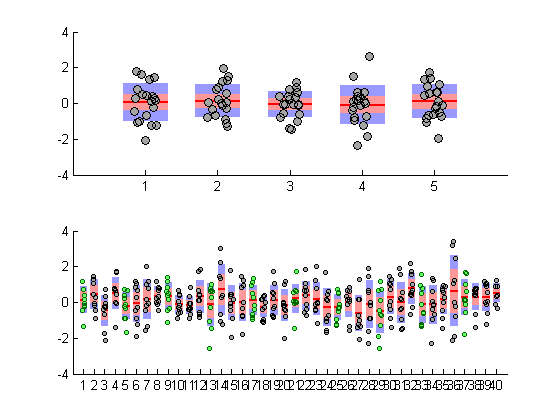
While box plots give the statistical information, you may also want the additional insight that you get from the raw data points. You can do that by holding the graph and plotting the data. Or you can just use Rob's function, which overlays the original data in a clever way, with some jitter to better distinguish the points.
figure;
subplot(2, 1, 1)
notBoxPlot(pts1);
subplot(2, 1, 2)
h = notBoxPlot(pts2);
d = [h.data];
set(d(1:4:end), 'markerfacecolor', [0.4,1,0.4], 'color', [0,0.4,0]);
set(d, 'markersize', 3);

There are quite a few entries on File Exchange that are related to boxplots, but I was quite intrigued by Rob's way of visualizing the data points. I like how he extended an existing functionality in the toolbox to create his reusable function. His function has a well-written help text with many examples, and I appreciate the healthy discussions he has on the entry page with some of the users of his function.
Comments
Give it a try and let us know what you think here or leave a comment for Rob.
- 类别:
- Picks


评论
要发表评论,请点击 此处 登录到您的 MathWorks 帐户或创建一个新帐户。